

I. Introduction
The prevalence of diabetes in New Zealand is substantial, and the Ministry of Health (MoH) of New Zealand has thus defined it to be a national health priority. The MoH has set targets for each local District Health Board (DHB) to meet. Health target means a set of national performance measures specifically designed to improve the delivery of health services that reflect significant public and government priorities. They provide a focus for action [1]. In New Zealand, the DHB is the organization responsible for ensuring the provision of publicly funded health and disability support services for the population of a specified geographic area; there are 20 in all.
The MoH in New Zealand offered free annual diabetes checks to people with diabetes in New Zealand from 2000 to 2012. The uptake of free annual diabetes checks can be measured as a potential indicator of access to good quality of care for patients with diabetes mellitus (DM). The target programme also monitors the level of HbA1c (glycated haemoglobin, a measure of diabetes management) and fasting lipid tests (a measure of cardiovascular disease risk). All such programmes require an accurate method for tracking the number of people diagnosed with DM in the population as the denominator by which to evaluate the program [2].
New Zealand has for a long time wished to establish a database of individuals with specific health issues to be used to determine the coverage and quality of the health system. Complicating factors include privacy concerns, regulation changes, and funding. New Zealand, however, collects data on many activities in healthcare in electronic format, including an individual patient National Health Identifier (NHI number).
The MoH has established the national Virtual Diabetes Register (VDR) by combining and filtering various sources of health activities of people with diabetes. The development of the VDR started in 2007 with an exploration of nationally collected hospital discharge diagnosis codes within the MoH. There have been continuous improvements in relation to its specificity, and sensitivity has been maintained through collaboration with local PHOs to validate the results.
The current methodology was progressively modified and fully established in 2009. Before the establishment of the VDR, the prevalence of diabetes was estimated using national surveys to measure self-diagnosed diabetes in the community. However, this proved to be slow, costly, and inaccurate [3].
The attraction of the VDR is that, by combining many data sources, accuracy can be increased and the resultant national database can be used to examine the importance of diabetes in particular cohorts. The VDR has provided a foundation for more solid evidence-based policies in the diabetes sector of the Ministry.
II. Case Description
1. System Architecture of the VDR
New Zealand uses the terminology 'National Collections' to refer to health and disability utilisation data collected nationally. Some data is captured locally (by DHB public hospitals for example) and some is captured centrally by the MoH (private hospitalization data and maternity claims for example). The recording of information is done in accordance with guidelines set by the Health Information Standards Organisation (HISO). The HISO supports and promotes the development, understanding, and use of fit-for-purpose health information standards to improve the New Zealand health information system [4]. The captured information is stored within the MoH data warehouse, and it is available to MoH analysts for various purposes. The update time interval varies for different types of nationally collected data.
NHIs are updated in real time, but some data may take as long as 3 months to be updated, e.g., PHO enrollment. The quality of the data is monitored by the national collection team within the MoH, which also has a dedicated team maintaining the data warehouse.
The Ministry used SAS (SAS Institute Inc., Cary, NC, USA) as the main analysis tool that connects to the data warehouse, and the VDR is also built using SAS. The Ministry runs the SAS Business Intelligence system on the IBM AIX server. The server is accessed by some 75-100 users within the Ministry for various types of modelling, such as epidemiological research, cost benefit analysis of a particular treatment, calculations for public hospital service pricing, and modelling of population-based capitated funding formulae.
2. Databases used for VDR
Various datasets from diverse healthcare sectors have been merged into the VDR system.
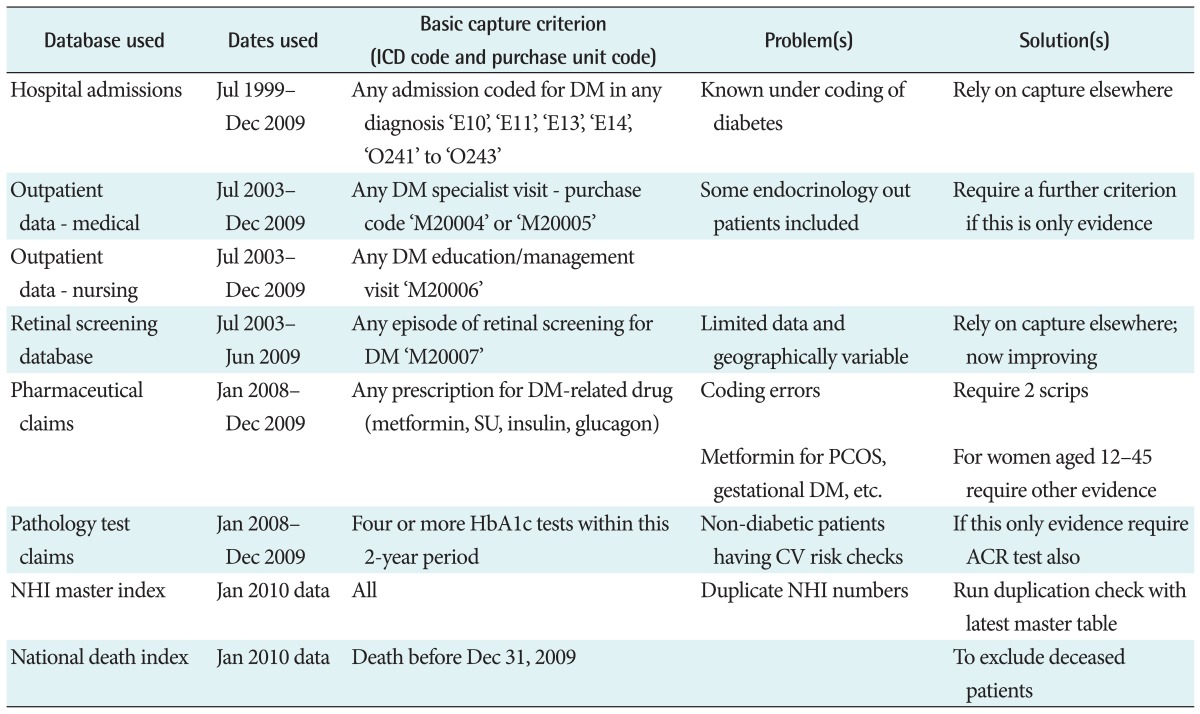
Hospital admissions coded for DM and outpatient attendance for DM as well as DM retinal screening databases were used in conjunction with the dispensing of specific anti-diabetic drugs and laboratory orders for HbA1c and albumin creatinine ratio. In summary, five major national databases were used for the VDR.
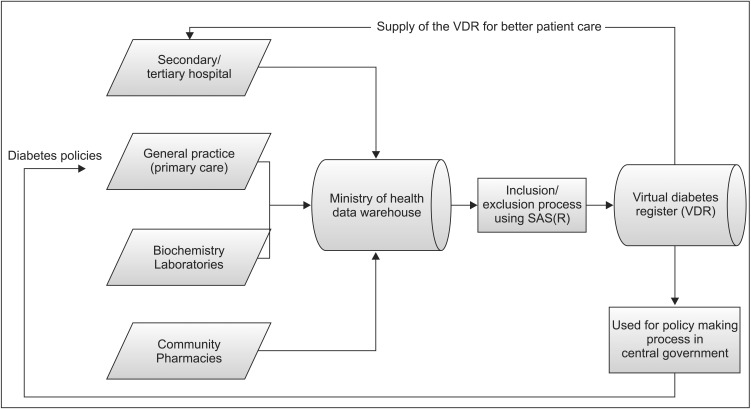
Figure 1 shows how the various databases are combined in the VDR. The combined VDR has become a source for diverse statistics and policy resources. Of course, during the process of creating resources, the algorithm was progressively modified to improve sensitivity and specificity, and it was validated against primary care DM registers.
Primary data, linked by the NHI number, was available from six relevant databases at the New Zealand MoH. The NHI number is a unique identifier that is assigned to every person who uses health and disability support services in New Zealand [5].
Logical strategies were devised to overcome data limitations; these are summarized in Table 1. It also shows the timeframe used to derive a VDR on December 31, 2009. The final list was then checked against the national mortality collection to remove deceased patients. The VDR is updated yearly around early March using the date of December 31 of the previous year to allow most of the data to be captured and stored within the MoH's data warehouse. The final VDR data sets are stored within the Ministry's SAS server.
The VDR in its original form contains identifiable, traceable, individual-level information, which is only available to selected users within the MoH. An anonymized version without NHI numbers or identifiable patient information is used for all major analyses and it includes such factors as age, gender, ethnicity, deprivation index, and many others.
Intrinsically, in this situation, an increase in the specificity of the algorithm will lead to decreased sensitivity. However, validation through local primary health organizations revealed that checks for the true diabetic patients made it possible to obtain the final figures using the optimal method at present.
Only patients enrolled with a PHO are counted for most purposes, and targets are provided to DHBs; this represents a reduction of about 5% from the notional national population.
PHOs are funded by DHBs to ensure the provision of essential primary healthcare services, mostly through general practices, to those people who are enrolled with the PHOs [6]. Many of those not registered are in the process of moving or changing PHOs/GPs, etc.
3. Information Flow for VDR
In New Zealand, information from secondary and tertiary healthcare facilities is passed to the MoH. However primary healthcare and community care functions within the private (but funded) sector and selected information is passed to the MoH as a contractual requirement. To ensure accuracy and completeness, utilisation data from the community, primary, secondary, and tertiary sectors must be included and combined.
The ethnicity and Deprivation Index was derived from NHI database, and the ethnicities were prioritized in the following order: Maori, Pacific, Indo-Asian, and European/Others.
The Deprivation Index is a measure of socio-economic status calculated for small geographic areas. The calculation uses a range of variables from the 2006 Census of Population and Dwellings, which represent nine dimensions of social deprivation. The Social Deprivation Index is calculated at the smallest geographical level defined by Statistics New Zealand, and it is built up to the relevant geographic scale using the weighted average census of 'usually-resident' population counts [6].
Figure 2 shows the full circulation of data sets into policies.
4. Prevalence Rate of Diabetes using the VDR
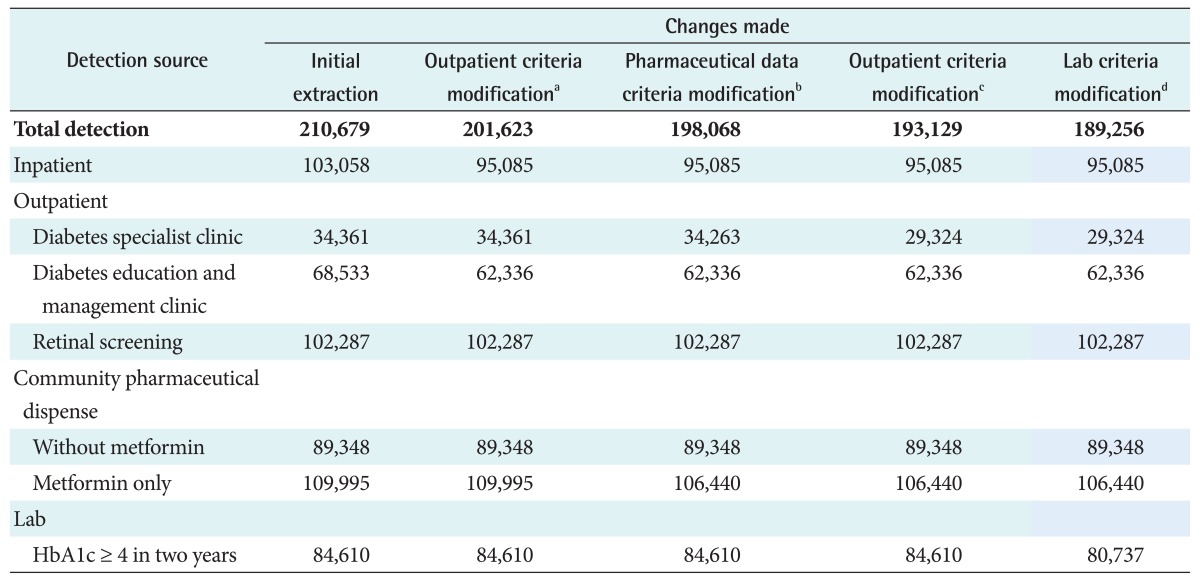
With initial use of the uncorrected algorithm, the VDR yielded an estimate of 210,679 (4.88%) people with diabetes as of December 31, 2009 among an estimated New Zealand population of 4,315,355. Feedback from many primary care providers indicated that the numerical estimates supplied to PHOs were a significant overestimate compared with local data. The corrected method described reduced this final estimate to 189,256 (4.39%). The number of individuals detected by each database used alone and exclusively by each method is given in Table 2.
The initial algorithm yielded an estimate of 210,679 people with diabetes; this was clearly somewhat non-specific, and analysis of this at the practice level showed particular evidence of over-coding via hospital admissions and medical outpatient visits. There was also an apparent excess of individual codes based on frequent measurement of HbA1c, suggesting that this had sometimes become a part of high-frequency cardiovascular screening, especially as HbA1c was not part of current diagnostic criteria for diabetes at the time.
The modified equation is therefore more specific, but it is also likely to be somewhat insensitive and therefore to be an underestimate. For example, it will not detect a newlydiagnosed patient with type 2 diabetes until they have had 4 HbA1c measurements, undergone retinal screening, attended an outpatient clinic, or received two or more prescriptions for oral hypoglycaemic agents. This is likely to involve 6-12 months for most patients, with a possible additional delay of 1-12 months before coding and data entry are complete, and the algorithm is run again. If the patient is simply on lifestyle measures and is not referred for retinal screening or is still waiting for an appointment, then the delay might well exceed two years.
5. Prevalence Rate by Age and Ethnicity
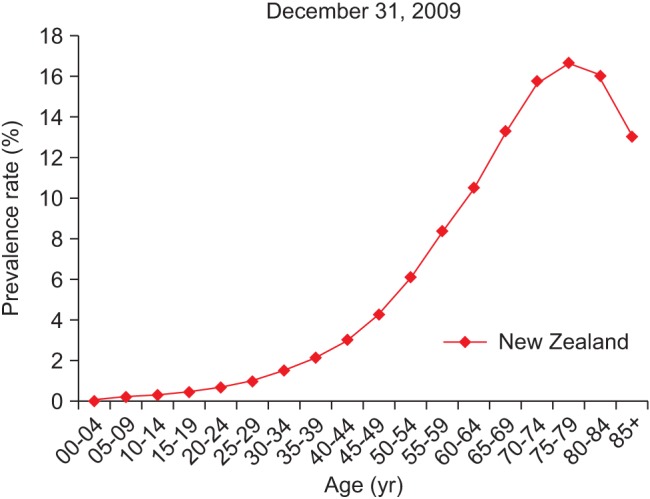
Figure 3 shows DM prevalence by age group, whereas Figure 4 shows the DM prevalence of four major ethnicity groups in relation to age group. Figure 4 is based on the DM population of European/Other = 126,330, Maori = 24,566, Pacific people = 9,616, and Indian = 8,942.
It shows clear differences between European, Maori, Pacific, and Indian ethnicities with the latter two having higher prevalence rates and occurring at a younger age; Maori are between these and European rates, but again, they are diagnosed younger. Pacific and Indo-Asian people show high prevalence around 20 years earlier (for a 10% prevalence rate) than the European group. Pacific and Indian ethnicities are reaching a peak 40% prevalence rate at age 70-74, which is 25% higher than the European peak rate of about 15%.
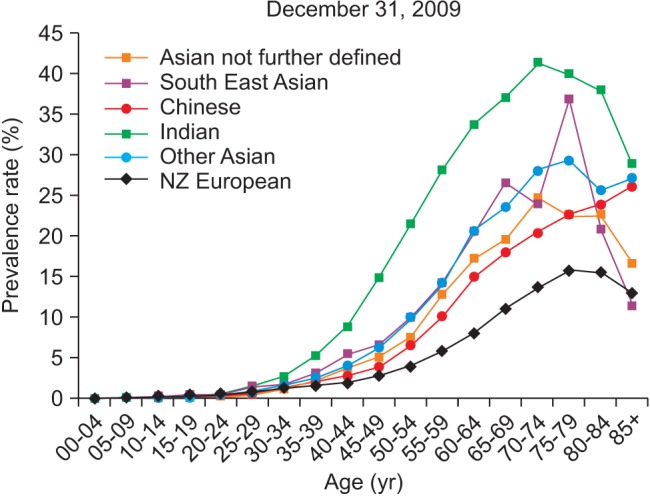
Figure 5 shows diabetes prevalence by Asian ethnicity. DM prevalence in the Indian population is the highest among the Asian group, and Chinese Asians show the lowest prevalence, but is considerably higher than that of the European group based on diabetes population of 'Asian not further defined' = 813, 'South East Asian' = 1,007, 'Chinese' = 4,658, 'Indian' = 8,942, 'Other Asian' = 2,410, and New Zealand European = 87,886.
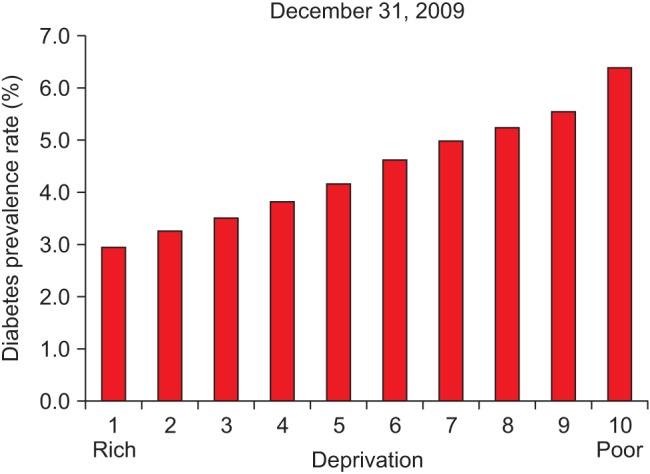
6. Prevalence Rate by Deprivation
Figure 6 shows the DM patient distribution in relation to deprivation group based on 179,454 PHO enrolled DM patients in New Zealand. The analysis revealed that the higher (worse) the deprivation, the higher the diabetes prevalence, indicating that deprivation is very highly associated with diabetes in New Zealand.
7. Prevalence Rate Trend
Figures 7 presents diabetes prevalence rates obtained from information sources in two categories: PHO enrolled and all DM patients in New Zealand. The VDR has enabled very specific comparison analysis between certain population groups to be made for the entire population rather than using a sample.
III. Discussion
The method appears to be superior to any national survey methods being utilised, mainly because it is not based on a sample; rather, it is based upon the whole population. This enables the MoH to monitor prevalence and performance, but in addition, it enables local DHBs and primary care organizations to monitor prevalence and performance using their local numbers.
It is clearly reliant on high-quality definition of DM according to the International Classification of Diseases (ICD-10) [7], and other coding and true validation is difficult without a separate survey. The VDR seems to be the best option to monitor diabetes prevalence unless a national diabetes registry has been established; however, establishment of a true national diabetes registry would require individual patient consent and additional IT resources.
The VDR can be easily applied to other areas, such as amputations or end-stage renal disease, by the addition of more information. New Zealand now uses the VDR to determine the official diabetes prevalence figures, and the summary is published in the MoH's annual Health and Independence Report every year [8].
The VDR is a good example of data being converted into evidence, the evidence being used to shape new policy, and then the policy being applied in the health sector with the full circulation of health information. Overall, this paper suggests that different datasets from various IT systems can be unified into one data warehouse for specific purposes to produce important information for monitoring the specific diseases of a target population for the benefit of the whole population. These data warehouses are effectively utilized to provide a base resource for a variety of policies.