


I. Introduction
Internet of Things (IoT) systems are considered by some authors to constitute the fourth (4.0) industrial revolution, promising several changes in all aspects of human life [1]. Over the last decade, the IoT paradigm [2] has boosted scientific interest in diverse applications and economy fields as well as in various populations; thus, it has become a globally innovating technology trend. IoT has gradually become a part of health, agriculture, and industrial research [3].
There are multiple IoT application scenarios. Devices or physical/virtual things are used to perform functions or recognize the physical world and its context, for example, in home services and intelligent industries, health care services, self-care, environmental monitoring, logistics, defense, transportation and safety [45].
These technologies may become adaptability catalysts, leading to the evolution of a new generation of services and devices that will dominate technological and social ecosystems [6]. It is possible to foresee that the systems and services conceived by these next-generation technologies will absorb various domains, such as home healthcare, clinical healthcare, medical follow-up, online government services, transportation, supply chains, energy supply, and other essential public services [78].
The development of next-generation devices and services results in the increased generation of huge amounts of data that must be stored, processed, analyzed and presented in an efficient, transparent, and easy-to-interpret way [9]. For this purpose, the systems in the cloud will provide the necessary infrastructure for the processing and subsequent presentation of the supplied information. In this way, they will integrate large sections of monitoring, storage, analysis, visualization, and delivery of information to the final user [1011]. The trends indicate that the healthcare and medical industry will support and encourage the growth of these new technologies, based on the precedent of the cost of implementation and operation of devices. In this context, IoT technologies can establish an impact point for health control via an affordable and efficient method [12].
Pulse oximetry was first implemented in 1972 by Takuo Aoyagi [13]. Since its introduction, it has been based on arterial oxygen saturation (SaO2). This method has become crucial for the clinical routine, because it provides important information about the cardiovascular function of patients. Pulse oximetry can use two types of measurements, namely, the SaO2, which is a direct measurement of the oxygen contents, and the blood oxygen saturation (SpO2), which is an indirect measurement of the blood oxygen [1415]. The SpO2 is one of the vital survival parameters; it is used in the follow-up of elderly patients and newborns, among others [16]. This method is complemented by the measurement of heart rate (HR); this is the repetition in a time interval of the beats generated by the heart (heartbeats). These heartbeats are produced because the heart behaves as a muscular tissue pump [1718].
The saturation of blood oxygen is the measurement of the percentage of oxygen available in the bloodstream. When the blood flows from the heart to the rest of the body, it passes through the lungs first, where the blood cells meet oxygen molecules [1920]. For the development of the prototype, the option to conduct partial blood oxygen saturation measurements using SpO2, was considered. It was also considered in previous works [2122232425]. In this case, pulse oximetry was conducted through the measurement of the oxygen transported by hemoglobin in the interior of the blood vessels; this was added to the measurement of the peripheral heart frequency and rhythm through the measurement of the partial oxygen saturation parameters and the HR [1420].
This study focused on the development of SpO2 and HR measurements that will allow the monitoring and estimation in real time of the user's state and health related to the established parameters, all framed inside the trend of using even more energy-efficient devices that are also environmentally friendly, taking other developments as a reference point for heart rate telemonitoring using the SpO2 technique. For our case, the development of Bluetooth low-energy (BLE) devices was taken into account, which comply with low-cost and open-hardware solutions operated via http requests for data transmission and reception from a cloud server to an edge device. Finally, the required network performance assessment was conducted to guarantee the availability and integrity of the acquired values and signals.
II. Case Description
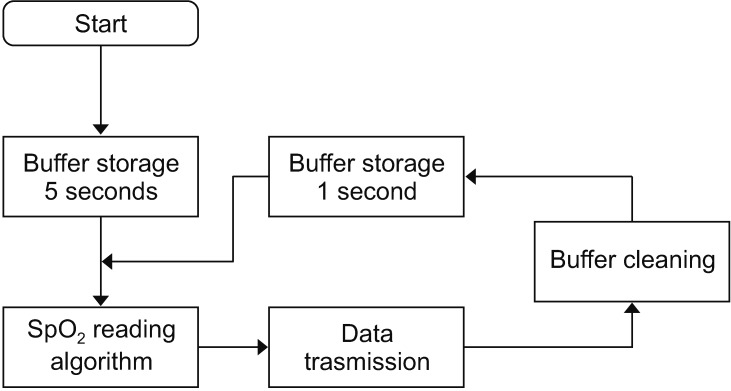
To obtain the blood oxygen saturation (SpO2), and HR signals for oximetry, the sensor used was MAXREFDES117#. This sensor is an optical HR monitor and pulse oximeter; it features the MAX30102 with integrated red and IR LEDs for HR and SpO2 detection, with 1.8 V power, LED color reading, infrared LED, and delivery of data via I2C with an approximate value of US $20. To achieve the reading of the variables, a reading sequence was established, as shown in Figure 1.
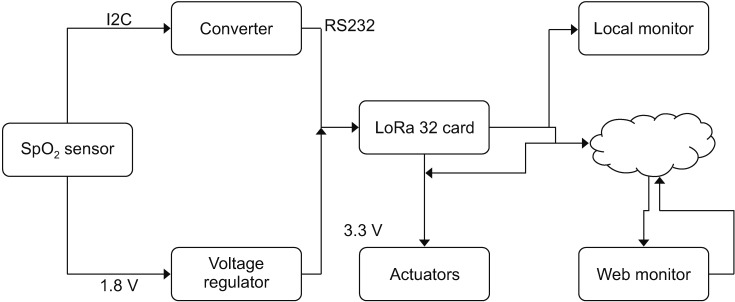
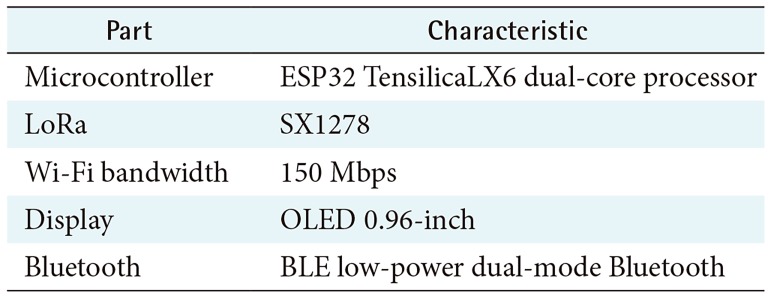
Once the reading sequence was established, the architecture for the system of acquisition, transmission, and monitoring of the signals of the IoT system was formulated (See Figure 2). Subsequently, a Wi-Fi LoRa 32 card model, manufactured by Heltec-China, was used for the implementation, with an approximate value of US $20. It provided the advanced LoRa spread spectrum communication technology, transmission reception of ultra-long-distance and low-power-consumption BLE. Table 1 shows the specifications of the Heltec card.
The calculation from the SpO2 is based on Equation (1), where the determination of the K1, K2, and K3 constants is required, which depend on the records from previous measurements. At start time, the system takes readings and stores the records for exactly 5 seconds, as seen in Figure 1:
Where SpO2 is calculated through the average radius, this average radius is calculated, with the average ratio of IR and red LED [16]. The average is obtained from the infrared LEDs and the K1, K2, and K3 constants, as previously explained. It is important that for the average calculation, 25 readings are made. The measurements delivered by the cardiac monitoring system correspond to the readings from the red LED, infrared LED, validation of the measurement, HR and SpO2, as shown in Table 2.
An actuator with two states, normally closed-NC and normally open-NO, was used for the activation once the monitoring system detected a heart rate under 70 beats or over 90 beats per minute, this according to the HR interval maximum and minimum provided by specialized personnel in the physical performance center where the tests were carried out.
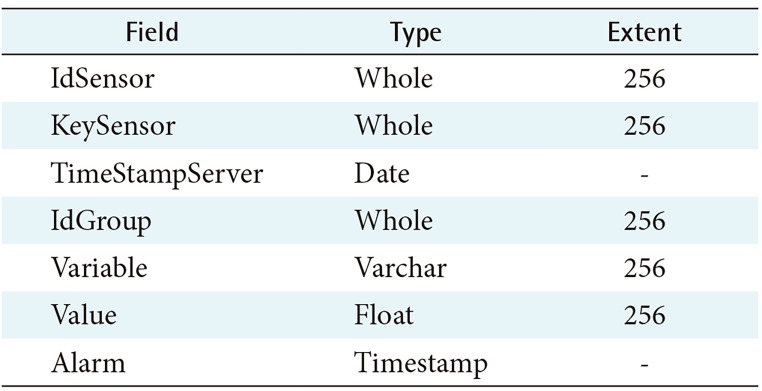
The results obtained from the four measurements and their corresponding validations are sent through LoRa, which supports the frequency bands of 433ŌĆō470 MHz and 868ŌĆō915 MHz with the maximum sensitivity of ŌłÆ139 dBm. The communication distance of the measured open area is 3.6 km (packet loss rate <0.3%; Wi-Fi up to data rate: 150 Mbps @ 11n HT40, 72 Mbps @ 11n HT20, 54 Mbps @ 11 g, 11 Mbps @ 11 band 200 m of distance), the last BLE up to 35 m, with a consumption of 20% less, on average, than the two reference systems. The saving in energy consumption was obtained in comparison to other oximeters models available on the market. As a comparison case, the jzk-301 presented an average consumption of 90 mW, the ESAMACT with a consumption of 108 mW, while the proposed system had an average consumption of 76 mW. The system operates via an HTTP request made to the server. These results are stored in a database implemented in MySQL through a PHP script. Data is stored in its corresponding table called IoT health as seen in Table 3.
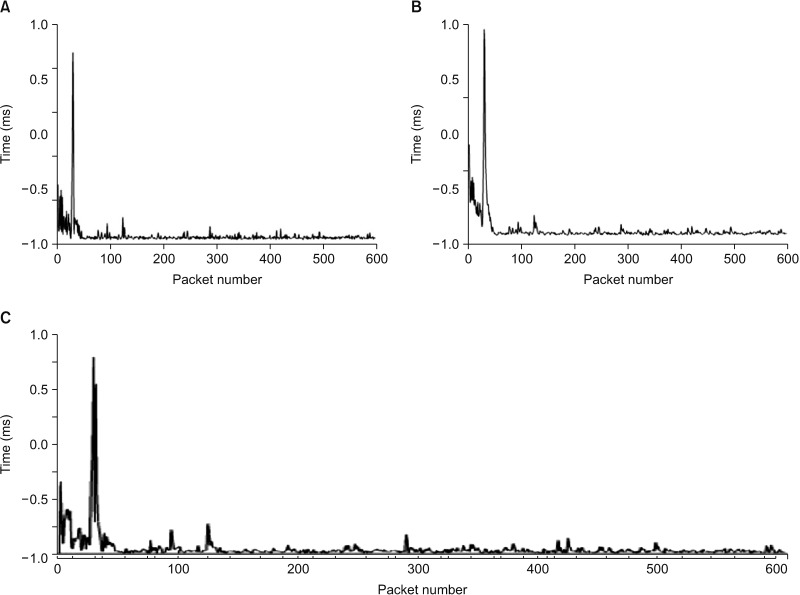
The data is available in the server and visualized via the web. Measurement parameters were obtained for the availability and performance of the prototype and connectivity with the server where the remote monitoring and control module is. The assessed metrics were the following: end-to-end delay, latency, jitter, and throughput. Figure 3 shows the end-to-end calculated delay from the beginning of the capture of the variable to the received confirmation from the server. Figure 3A shows how the initial events when establishing their connection with the server, present a delay of over 30 ms, but once the connection time passes, the delays tend to remain under 30 ms. Figure 3B shows the network latency, which matches the network delays shown in Figure 3A. According to what it shows regarding the initial connection times with the server, the latency is elevated, but once the connection is established, latency decreases. Finally, Figure 3C shows the jitter behavior during the assessment period, which reflects a behavior similar to that of end-to-end delay and latency, since jitter is based on the previous metrics.
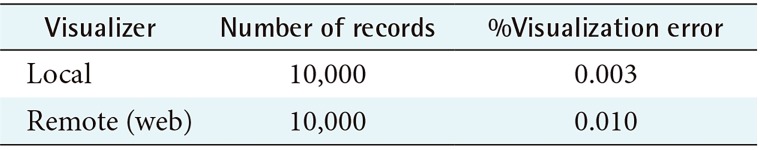
The result obtained in the remote visualization module via the web was compared to the result shown in the OLED screen of the local monitoring module, presenting an average visualization time difference of 27.8 ms on an internet channel with 2048 kbps from the remote visualizer compared to the local visualizer. The validation of the delivered data versus the remotely visualized data was conducted, and the results are shown in Table 4.
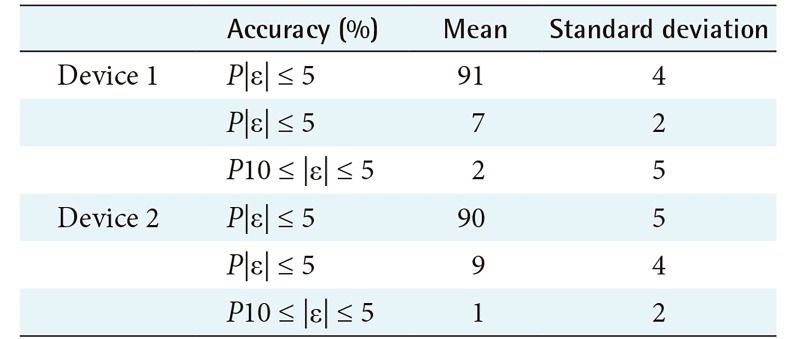
To validate the data acquired by the new developed system, it was compared with two different SpO2 measurement devices on the market. The first was the MD300C20_OTC oximeter manufactured by Omron-India; the second device was an ESAMACT LED fingerprint oximeter, manufactured by ESAMACT-China; all validation was done under controlled laboratory conditions. A hundred local readings were conducted per device during six reading sessions for the same individual. The results are shown in Table 5.
Results from the comparison of such two reference devices were obtained from three precision bands: lower to 5%, between 5% and 10%, and higher than 10%. In these two cases, the system achieved at least 90% success for 5% lower precision regarding both devices. The results are shown in Table 5.
III. Discussion
The work done in this study allowed the verification of the possible implementation of IoT systems in the health sector and home healthcare through open hardware, with a visualization error of 1% and latency times under 600 ms.
The visualized results and the average measured percentage errors, allow the verification of the system's efficiency, which may indicate an opportunity for the analysis and processing of medical data for the subsequent construction of control, forecast, and estimation methods for patients receiving healthcare or healthy individuals in real time.
Due to the characteristics of the used components, greater port availability for the activation of a greater number of actuators and controllers is possible. This contributes to the prevention of events, control of the user's body variables, control of environmental variables, and effective follow-up after medical procedures.
Measurements obtained by this low-cost hardware were always above 90% at the highest precision interval. This allows us to conclude that these open, low-cost systems are a real alternative to the existing systems with the potential to provide higher access to services and resources at lower costs.