Prediction and Staging of Hepatic Fibrosis in Children with Hepatitis C Virus: A Machine Learning Approach
Article information

Abstract
Objectives
The aim of this study is to develop an intelligent diagnostic system utilizing machine learning for data cleansing, then build an intelligent model and obtain new cutoff values for APRI (aspartate aminotransferase-to-platelet ratio) and FIB-4 (fibrosis score) for the prediction and staging of fibrosis in children with chronic hepatitis C (CHC).
Methods
Random forest (RF) was utilized in this study for data cleansing; then, prediction and staging of fibrosis, APRI and FIB-4 scores and their areas under the ROC curve (AUC) have been obtained on the cleaned dataset. A cohort of 166 Egyptian children with CHC was studied.
Results
RF, APRI, and FIB-4 achieved high AUCs; where APRI had AUCs of 0.78, 0.816, and 0.77; FIB-4 had AUCs of 0.74, 0.828, and 0.78; and RF had AUCs of 0.903, 0.894, and 0.822, for the prediction of any type of fibrosis, advanced fibrosis, and differentiating between mild and advanced fibrosis, respectively.
Conclusions
Machine learning is a valuable addition to non-invasive methods of liver fibrosis prediction and staging in pediatrics. Furthermore, the obtained cutoff values for APRI and FIB-4 showed good performance and are consistent with some previously obtained cutoff values. There was some agreement between the predictions of RF, APRI and FIB-4 for the prediction and staging of fibrosis.
I. Introduction
Hepatitis C virus (HCV) and chronic hepatitis C (CHC) constitute a serious health burden worldwide [1]. In 2015, It was estimated that 399,000 deaths occurred due to hepatitis C complications, in particular, cirrhosis and hepatocellular carcinoma [1]. It was also found that Egypt had the highest prevalence of HCV [1]. So far, liver biopsy is still the gold standard for diagnosing and staging of liver fibrosis in both adult and pediatric patients [2]. However, it is an invasive, painful, and expensive process; moreover, it leads to complications in 0.9% of patients, who might need hospitalization afterwards [2]. For the paediatrics cases, it also requires general anaesthesia and is prone to errors in diagnosis and/or staging of fibrosis which may reach 20% to 30%. This can be attributed to the poorly represented liver state, considering the liver size of a child, and inter- and intra-observability errors [2]. This means that a biopsy should be only considered if a child is at a real risk of liver damage [3]. The aforementioned complications and errors have led to the need, and therefore the introduction of various non-invasive diagnostic biomarkers for liver fibrosis based on routine laboratory tests, serum biochemical markers, and various imaging techniques mainly to measure liver stiffness, or a combination of some or all these markers [45]. It has been shown that non-invasive methods became more accurate for predicting, excluding, and staging of hepatic fibrosis; therefore, liver biopsy can be avoided [6]. The most common fibrosis scoring systems include alanine aminotransferase/aspartate aminotransferase (AST/ALT) ratio, AST-to-platelet ratio (APRI), and fibrosis score (FIB-4). All these scores (cutoff values) have been utilized to predict advanced fibrosis in adults. However, several studies have shown that they are not appropriate for children [24], and there is an urgent need to validate and introduce new cutoff values for pediatrics [378]. It has also been shown that intervention during the early stages of hepatic fibrosis can slow the development of liver cirrhosis and may reduce the risk of developing liver cancer [9]. In addition, there is clear evidence, based on findings from repeated biopsy, that mild to moderate fibrosis is reversible [10], but it is not fully reversible when cirrhosis is present [10]. In this paper, an intelligent diagnostic system based on random forest (RF) for the prediction and staging of fibrosis in pediatrics is proposed, for the first time. Furthermore, cut-off values for APRI and FIB-4 were obtained for children with CHC, and for Egyptian children. The obtained RF model, APRI and FIB-4 cutoff values were further validated on an independent validation dataset. As the result section shows, RF, APRI, and FIB-4 obtained scores of high accuracy and AUC (areas under the ROC curve). Furthermore, the obtained APRI and FIB-4 cutoffs are consistent with those obtained in other pediatrics studies for non-alcoholic fatty liver diseases (NAFLD), and/or chronic liver diseases in general. The rest of the paper is organized as follows. Section I-1 offers a brief background on the machine learning (ML) algorithms utilized in this study, and related work is reviewed in Section I-3.
1. Machine Learning Technique Utilized in This Study
RF was utilized in this study. The idea of RF [11] is based on having an ensemble of decision trees, in particular, classification and regression trees [11]. This ensemble is composed of a combination of tree predictors, each of which is grown utilizing a random subset of features to split each node, and a random set of vectors sampled independently. The lower the correlation between different grown trees, the lower the generalization error the forest will have [11]. The generalization error also depends on the individual trees strengths; strong trees have low error rates [11]. RF also internally estimates the features' importance for the classification/regression tasks. To classify a new example, each tree votes for a class, and majority voting is used to decide the final class of that example [11]. RF work very well with large and/or imbalanced datasets. It has excellent generalization performance that outperforms boosting algorithms, and it is robust to over fitting.
2. Indirect Serum Biomarker Utilized in This Study
In this study, we obtained the scores of APRI and FIB-4 biomarkers on our dataset using the following formulae [5]. This in addition to the AST/ALT ratio:
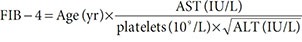

where ULN is upper limit of normal.
3. Related Work: Machine Learning and Data Mining in Hepatic Diseases
Several researchers have utilized ML for the diagnosis of hepatic diseases, some of them for the prediction and staging of fibrosis. Chen et al. [9] utilized support vector machines, K-nearest neighbor, and naive Bayes (NB) to diagnose hepatitis B. Eleven features from real-time tissue elastography (RTE) images, for 513 subjects were utilized. The authors obtained improved performance with RF, which outperformed other techniques in terms of the liver fibrosis index [9]. In a different study, NB and decision trees (DT) were utilized to predict HCV vertical transmission factors among new-born Egyptian children [12]. Again for the Egyptian population, and in a prospective study for 39,569 HCV patients [13], DT, genetic algorithms, multi-linear regression, and particle swarm optimization were employed to predict advanced fibrosis in adults, by combining serum biomarkers and clinical data. Advanced fibrosis was predicted with an AUC between 0.73 and 0.76, and accuracy between 66% and 84% [13]. In a study also considering Egyptian adult patients, pre-treatment and histopathological data for 69,106 chronic HCV patients were the input to DT to predict advanced fibrosis [14]. The relevant features of advanced fibrosis were identified as age, ALT, and platelets. However, the performance of DT in terms of AUC was not reported. In another study for predicting the stages of fibrosis in Egyptian chronic HCV adult patients [15], 20 features from lab data for 296 patients as well as transient elastography measurement were input to a DT, while the stage of fibrosis was the output class. The accuracy achieved by 10-fold cross-validation was 74%. Liver stiffness was the most relevant attribute [15].
II. Methods
1. Data Source
The dataset used here is the largest studied cohort of Egyptian children with only HCV; it consists of 166 child attending a pediatrics hospital outpatient. Those cases have been previously studied, and only a couple of abstracts have been published [1617]. However, none of these studies utilized ML algorithms for the prediction and staging of fibrosis. A summarized description of the dataset is given below, where the numbers in parentheses after each feature represent its range in the dataset.
Input (independent) features are age (7–16 years), sex (male, female), steatosis (0,1), ALT (23–250 IU/L), AST (13–361 IU/L), gamma glutamyl transpeptidase (GGT; 13–318 IU/L), cholesterol (81–280 mg/dL), platelets (92–657×109/L), blood urea nitrogen (BUN; 6.4–48 mg/dL), bilirubin (0.12–2 mg/dL), Internatinal normalized ratio (INR; 1–1.5), white blood cell count (2.6–16.9×10³/µL), hemoglobin (6.6–16.5 g/dL), and body mass index (10–31.11 kg/m2). The stage of fibrosis (F0, F1, F2, F3, F4, F5) according to [18] constituted the predicted class; grouped as detailed in each individual experiment. The total number for all types of fibrosis (F1 + F2 + F3 + F4 + F5) cases was 90, and the cases with no fibrosis (F0) were 76 cases. It should be noted here that, for F5 there was only one case; therefore, it was included in the advanced fibrosis cases.
2. Data Cleansing
Several ML algorithms have been tried with the full dataset above, using 10-fold cross-validation. The target classes were no fibrosis (F0) as the negative class, against any stage of fibrosis (F1, F2, F3, F4, F5) together as the positive class. The RF with 100 trees, each constructed utilizing 5 random features, and with the maximum depth of 3 gave the best accuracy of 78% and an AUC of 0.74. However, these results were of moderate quality, and this was the main motivation for using only TP and TN vectors (cases).
Therefore, the new (cleaned) dataset had 54% TP cases (F1, F2, F3, F4, F5), and 46% TN (F0). It was noted here that all the errors were in the classes of mild or no fibrosis, while all advanced fibrosis cases were correct and added to the dataset. This new dataset was used in all the following steps.
3. Training
The following section summarizes the experiments conducted using RF and 10-fold cross-validation.
1) Predicting the onset of any type of fibrosis
In this experiment, all the input features were used to train RF with the settings that gave the best results, namely, 100 trees, a maximum tree depth of 3, and 2 random features. F0 cases constituted the negative class (46%), while (F1 + F2 + F3 + F4 + F5) constituted the positive class (54%).
2) Predicting mild fibrosis
The same input features were used to train RF. The output (predicted) class was mild fibrosis (F1and F2 together) as the positive class (44%, 48 cases), and no fibrosis (F0) was the negative class (56%, 60 cases). The parameters used were 100 trees, with the maximum tree depth of 4, and 4 random features.
3) Predicting advanced fibrosis
Again all features were used as input, while the output either was F0 (73% of the cases, 60 cases) as the negative class, or positive class (F3, F4, and F5 cases together; 27% of the dataset, 22 cases). The best result was obtained with 100 trees, and maximum tree depth was 3 with only 2 random features.
4) Differentiating between mild and advanced fibrosis
The same input features used in the previous experiment were used, while the predicted class was advanced fibrosis (F3, F4, F5; 31%, 22 cases) as the positive class, and mild fibrosis (F1, F2; 69%, 48 cases) was the negative class. The parameters used were 100 trees with the maximum tree depth of 3 and 5 random features.
Figure 1 shows the steps in the proposed method.

Steps in the proposed method. RF: random forest, TP: true positive, TN: true negative, FP: false positive, FN: false negative.
4. APRI, FIB-4, and AST/ALT Scores
For each version of the datasets in Section II-3-1 to II-3-4, a score is obtained for each of APRI, FIB-4, and AST/ALT ratio, for the prediction/staging of fibrosis based on their AUC values.
5. Validation Dataset
Although the training was conducted with 10-fold cross-validation, the remaining cases from the original dataset (FN and FP were used to validate the obtained predictions, and for APRI and FIB-4 scores were obtained).
III. Results
1. Prediction of Any Type of Fibrosis
1) Random forest results
RF achieved an accuracy of 0.875 and had an AUC of 0.903. The two most significant features were age and bilirubin. Figure 2 shows the performance of bilirubin as a predictor of any type of fibrosis.
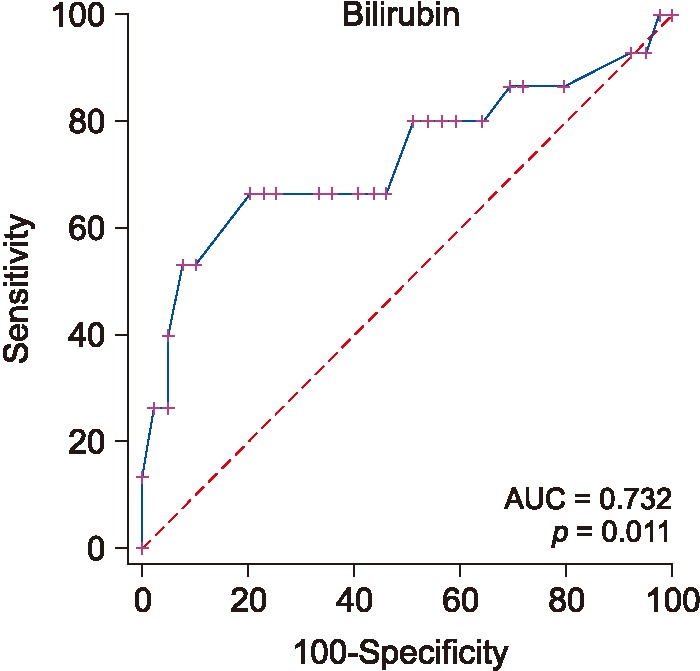
Bilirubin performance as a predictor of fibrosis.
2) ROC performance of APRI, FIB 4, and AST/ALT for predicting the existence of fibrosis
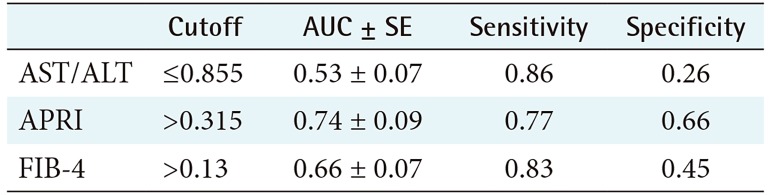
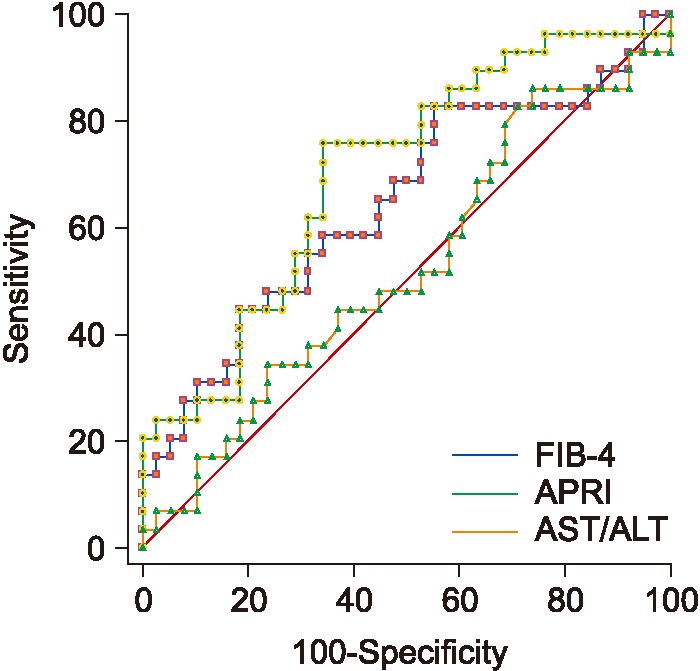
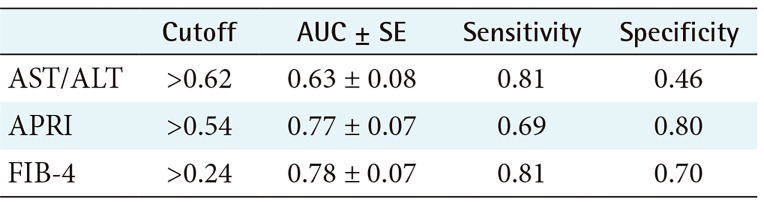
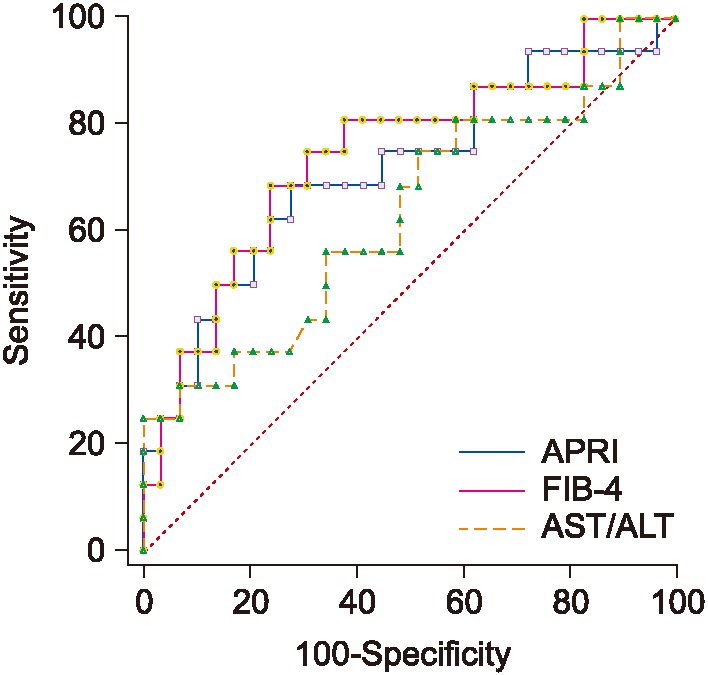
The performance and cutoff values of APRI, FIB-4, and AST/ALT biomarkers are shown in Table 1; the relevant ROC curves are shown in Figure 3. As seen in this Table 1, both APRI and FIB-4 achieve relatively good performance.
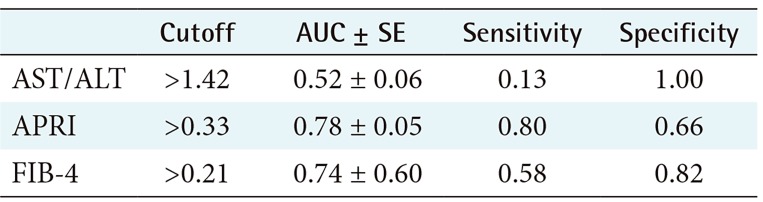
Serum biomarkers performance for any fibrosis
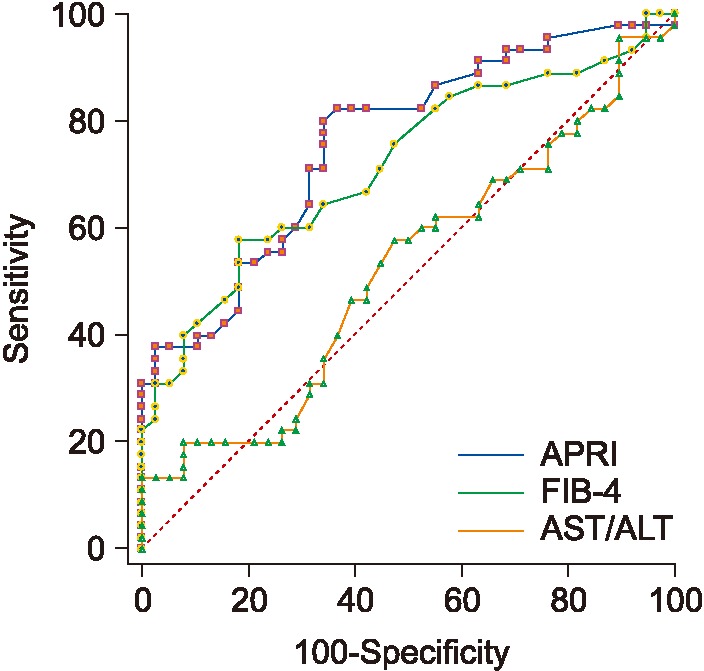
ROC curves for APRI, FIB-4, and AST/ALT ratio for predicting existence of any type of fibrosis. AST/ALT: alanine aminotransferase/aspartate aminotransferase, APRI: AST-to-platelet ratio, FIB-4: fibrosis score.
2. Prediction of Mild Fibrosis
1) Random forest results
RF achieved an accuracy of 66% and an AUC of 0.71, and the most significant features were GGT, platelets, bilirubin, and BUN.
2) ROC performance and cutoff values for APRI, FIB 4, and AST/ALT ratio for mild fibrosis
Table 2 shows the performance and cutoff values for APRI, FIB-4, and AST/ALT ratio, and Figure 4 shows the ROC curves. Again, APRI achieved the best performance, followed by FIB-4.
Serum biomarkers performance for mild fibrosis
ROC curves for APRI, FIB-4, and AST/ALT ratio for predicting mild fibrosis. APRI has the best AUC, followed by FIB-4. AST/ALT: alanine aminotransferase/aspartate aminotransferase, APRI: AST-to-platelet ratio, FIB-4: fibrosis score, AUC: area under the ROC curve.
3. Prediction of Advanced Fibrosis
1) Random forest results
In this experiment, the obtained accuracy was 80%, and the AUC was 0.894 with only 3 random features, which were bilirubin, platelets, and age. Figure 5 shows the distribution of bilirubin values for no fibrosis versus advanced fibrosis.
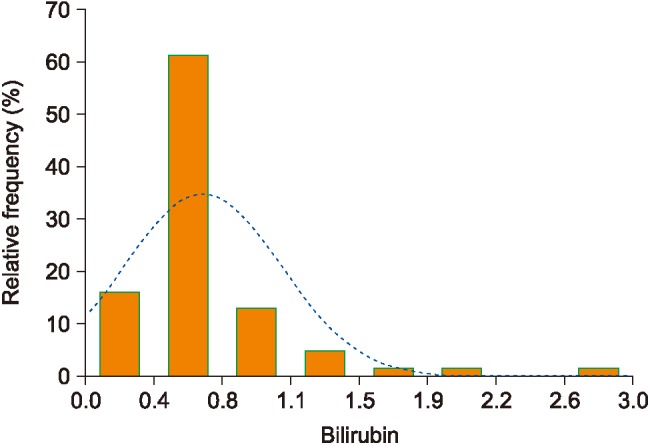
Bilirubin values distribution for no fibrosis/advanced fibrosis ≥0.9.
2) ROC performance for APRI, FIB 4, and AST/ALT for advanced fibrosis
Table 3 shows the obtained scores and cutoff values for APRI, FIB-4, and AST/ALT ratio. As seen in Table 3, FIB-4 obtained the best AUC followed by APRI. Figure 6 shows the ROC performance for APRI and FIB-4.

Serum biomarkers performance for advanced fibrosis
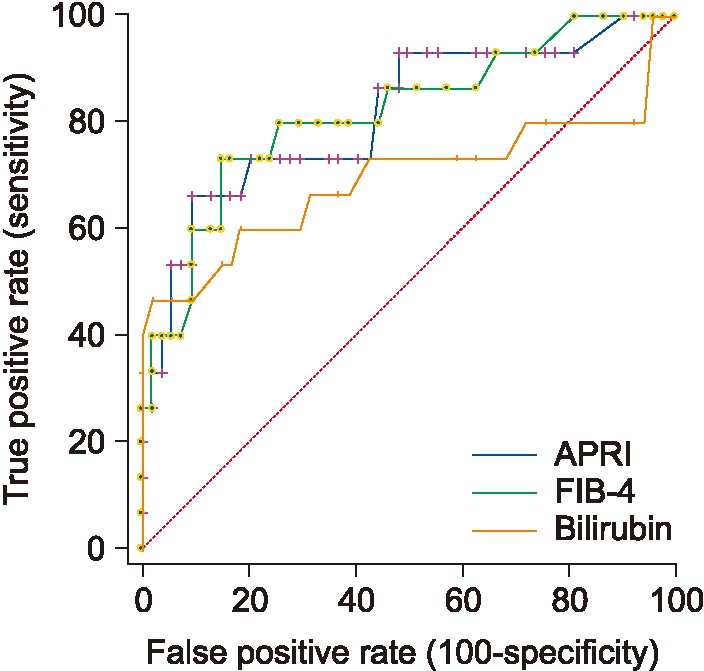
ROC curves for APRI, FIB-4 and bilirubin for predicting advanced fibrosis. FIB-4 has the best AUC followed by APRI. APRI: aspartate aminotransferase-to-platelet ratio, FIB-4: fibrosis score, AUC: area under the ROC curve.
4. Differentiating between Mild and Advanced Fibrosis
1) Random forest results
An accuracy of 79% and an AUC of 0.822 were obtained. The most important features were age, steatosis, ALT, AST, platelets, and bilirubin.
2) ROC performance for APRI and FIB 4 for mild/advanced
APRI, FIB-4, and AST/ALT results are shown in Table 4. As seen in Table 4, FIB-4 achieves the best AUC, followed by APRI. Figure 7 shows the ROC curves for the three biomarkers.
Serum biomarker performance for advanced/mild fibrosis
ROC curves for APRI, FIB-4, and AST/ALT for differentiating mild advanced fibrosis. FIB-4 has the best AUC followed by APRI. AST/ALT: alanine aminotransferase/aspartate aminotransferase, APRI: AST-to-platelet ratio, FIB-4: fibrosis score, AUC: area under the ROC curve.
5. Results on the Validating Dataset
As indicated in Section II, the validation dataset comprises the FP and FN cases obtained by RF trained with 10-fold cross-validation. It has 36 subjects in total, 17 positive cases (FNs), and 19 negative cases (FPs). The total sensitivity all methods (RF, APRI, and FIB-4) was 0.82, while the total specificity was 0.47.
IV. Discussion
1. Comments on the Obtained Results
Comparing the AUCs of different RFs and those of corresponding biomarkers, it can be seen that RF achieved better performance in predicting the onset fibrosis for that cohort of children. This can be attributed to the combined effect of various significant features. In particular, elevated bilirubin proved to be an important predictor for any type of fibrosis in addition to age. The situation is different for predicting mild fibrosis, where APRI produced a significantly better AUC (p > 0.05) than RF. For predicting advanced fibrosis, again RF produced the best AUC. This again can be attributed to the combined effect of three significant features, namely, platelet count, bilirubin, and age.
In the case of the validating dataset, APRI, FIB-4, and RF each had low sensitivity and specificity. However, the total sensitivity was high, as 14 out of the 17 cases were correctly classified as true positive by all three methods together. The low specificity (= 0.47) was due to high FPR, where 10 out of 19 were classified as false positive by RF, APRI, and FIB-4 together. However, except for one case, all false positives were classified as mild fibrosis. There was an agreement on classification by APRI, FIB-4, and RF in 60% of the cases, and there was agreement between APRI and FIB-4 in only 65% of the cases.
2. Features' Relevance
Predictions' interpretability is an important complementary measure of ML algorithms' performance, especially in medical diagnosis [19]. Looking at the RF prediction of various stages of fibrosis, it can be seen that in all cases, the most significant features are valid risk factors for predicting fibrosis. For instance, platelets appear in various fibrosis biomarkers, like APRI, FIB-4, and Forn's index [5]. Similarly, bilirubin is also used in the FibroTest/FibroSure, and ActiTest formulas [5]. Elevated BUN is correlated with liver fibrosis, and it has been utilized with other direct markers such as FibroMeter formula [5].
3. Related Results
To further validate our results, cutoff values for APRI and FIB-4 were compared with other previously published values for HCV-infected Egyptian children [1617]. In a study that excludes significant fibrosis from other stages of fibrosis, the cutoff value of 0.68 for APRI with an AUC of 0.921 was obtained [16], which is similar to our results for APRI; however, we obtained a lower AUC. In another study [17], FIB-4 and APRI showed an AUC between 0.79 and 0.76 with an APRI score of <0.68 for the exclusion of significant fibrosis, which again is the same value for APRI cutoff, but we obtained better AUCs for both APRI and FIB-4. In another study for children suffering from chronic liver diseases with only 4.8% having HCV, the mean score for APRI to predict advanced fibrosis (≥F2, Metavir score) was 0.71, while for no or mild fibrosis (<F2) it was 0.45; at a cutoff value of 0.58, the AUC was 0.746 [20]. It should be noted here that the cutoff in our work differentiates between no fibrosis (F0) and significant fibrosis (>F2) based on the score by Ishak et al. [18], while the two aforementioned studies excluded significant fibrosis from non-significant fibrosis based on the Metavir score [21]. For a non-Egyptian cohort of children [22], AST/ALT, FIB-4, and APRI were utilized to differentiate no fibrosis (F0) from the presence of any type of fibrosis (F1–F4), mild (F0–F1), versus significant (F2–F4) fibrosis in NAFLD. Statistically significant differences in the means were obtained by APRI. However, all markers had poor AUCs for the prediction and staging of fibrosis, ranging from of 0.67 to 0.59 for APRI and FIB-4, respectively. The mean cutoff values for APRI were 0.42, 0.70, 0.51, and 0.96 for F0, (F1–F4), (F0–F1), and (F2–F4), respectively. For FIB-4, the mean cutoff values were 0.24, 0.32, 0.27, and 0.35 for F0, (F1–F4), (F0–F1), and (F2–F4), respectively. In another study [23], APRI and FIB-4 were also evaluated for differentiating between two groups of NAFLD children, having mild (F0–F1) and significant (F2–F4) fibrosis. Both APRI and FIB-4 had significant differences between the two groups, with cutoff values of 0.78 and 0.31 for APRI and FIB, respectively, and AUCs of 0.70 and 0.81 for mild and significant fibrosis, respectively. Similar results were reported in [8] for differentiating no fibrosis (F0) from significant fibrosis (F3–F4), with AUCs of 0.67 and 0.64 for APRI and FIB-4, respectively. In another study aimed at differentiating mild (F0–F1) from significant fibrosis (F≥2) [4], APRI and FIB-4 had AUCs of 0.70 and 0.81 as well as median values of 0.63 and 0.33, respectively, for NAFLD children. Both APRI and FIB-4 achieved lower performance in detecting significant fibrosis, with AUCs of 0.666 and 0.686, respectively. In the same study [4], APRI had an AUC of 0.80 to predict patients with any type of fibrosis, and AST/ALT ratio performed poorly with an AUC less than 60%.
Several studies have validated various scores for adults and had cutoff values for APRI on an HCV cohort, ranging from 0.52 to ≥1.5 with AUCs of 0.721 and 0.87, respectively, for significant-to-severe fibrosis (≥F2), a cutoff of ≤0.5 for no or mild fibrosis (<F2), and an AUC ranging from 0.596 to 0.82 [52024]. For FIB-4, the cutoff value to exclude significant fibrosis in adults was <1.45 with an AUC of 0.85 and >3.25 for the prediction of fibrosis was with an AUC of 0.81 [5].
4. Study Limitations
Although the cohort used is the largest for Egyptian HCV children currently, the number of cases is relatively small, and the results obtained need to be further validated. Another limitation of the study is data imbalance in the classification of advanced/no fibrosis; as well as differentiation of mild from advanced fibrosis. This problem is the result of the small number of advanced fibrosis cases, as is not likely to find many cases in children. To handle this problem with a study of a larger cohort, a cost function can be used to get a better AUC, with particular attention to false positive cases. A limited under sampling for the majority classes can also be used with care to maintain the real distribution of the data because advanced cases are not common in children.
5. Conclusion
In this paper, an intelligent method for fibrosis prediction and staging in pediatrics has been developed. To the best of our knowledge, this was the first study targeting HCV children, aiming to differentiate between mild and advanced fibrosis as well as mild and no fibrosis. New cutoff values for APRI and FIB-4 in pediatrics for fibrosis detection and staging have been proposed for Egyptian children. These cutoff values confirm some values previously published in two other studies for other NAFLD pediatrics cohorts, as well as several adult studies; however, ours has better AUCs. Wider scale retrospective studies are needed to further validate the RF results and the obtained cutoffs for APRI and FIB-4. The obtained results demonstrated low-cost laboratory investigations as significant features; therefore, these predictions can be repeated periodically for screening and follow-up. The simple, noninvasive model in addition to the APRI and FIB-4 cutoffs obtained would enable timely intervention with medications. This would help reduce the number of liver biopsies taken from children, as well as HCV complications. Furthermore, they can be combined and used to assist medical experts in deciding what should be done as a next step on an individual basis. However, it should be noted here that neither the obtained scores nor the RF output can replace liver biopsy in some cases.
Notes
Conflict of Interest: No potential conflict of interest relevant to this article was reported.