

I. Introduction
Chronic kidney disease (CKD), a major risk factor for endstage renal (or kidney) disease, cardiovascular disease, and premature death, is a global public health problem, affecting more than 10% of the global population [12]. Kidney transplantation is considered the best alternative treatment for patients with end-stage renal disease because it offers some advantages, including better quality of life and longer survival compared to patients who are treated with dialysis [3]. It is estimated that more than 1.4 million patients with CKD receive kidney transplantation worldwide with an approximately 8% incidence growth rate annually [4]. Although there has been significant improvement in graft function and survival during the last two decades, many transplanted kidneys are rejected because of acute rejection and chronic allograft nephropathy. This in turn causes 3-fold greater risk of death compared to patients with functioning grafts [56]. There is an increasing demand for kidney transplantation; therefore, it is of great importance to identify the potential risk factors implicated in graft failure to improve patients' survival and quality of life [3].
Since failure of transplantation is associated with adverse consequences for patients, exploring, identifying, and controlling for risk factors are of utmost importance. Several potential prognostic factors affecting the success of renal grafts, such as the age and sex of donors and recipients, body mass index, type of donor (living or deceased), anemia, type of immunosuppressive regimen, and so forth, have been investigated in various studies [3]; however, the results have been inconsistent.
Several classification methods are used to predict a categorical response variable based on predictors and covariates. In this regard data mining (machine learning) techniques have been introduced, and they have achieved promising performance in classifying binary responses [7]. Among them, the artificial neural network (ANN) approach is used to create nonlinear models, and it is able to implicitly detect complex nonlinear relationships between dependent and independent variables and to detect all possible interactions between predictor variables [8]. ANN as a nonlinear, flexible and general tool is capable of dealing with any sort of arbitrary function [9]. On the other hand, traditional logistic regression (LR) is preferable when there is a sufficient sample size according to classes of response variable and a straightforward interpretation of results is required [10]. Therefore, it is crucial to utilize and compare the performance of these two methods in analyzing a dataset.
Several studies have applied ANNs and produced promising results in a variety of fields, including economics, medicine, psychology, meteorology, and neurology. These studies suggest that ANNs can be used as an alternative to multivariate analysis. However, their role has remained advisory because there has not been convincing evidence of any real progress in clinical prognosis [1112]. In nephrology, however, a few studies have utilized ANNs [12], and most of them have studied the ability of ANNs to distinguish predictive factors and other issues related to survival of dialysis patients [13]. In others that have investigated the performance of ANNs, only a few performance criteria have been used, and the importance of factors related to graft rejection have not been assessed [12]. Because the performance of classification methods is data dependent and because of the inconsistencies among studies regarding important risk factors related to kidney transplant rejection, the present study aimed to identify the risk factors and covariates affecting failure of renal transplantation as a binary response variable using LR and ANN (to consider nonlinear effects and all possible interactions between the variables) and to compare the results obtained by the two approaches.
II. Methods
1. Data
The present study used a dataset obtained through a retrospective cohort study that was conducted in Hamadan, western Iran, from 1994 to 2011. A total of 378 patients underwent kidney transplantation in Ekbatan or Besaat hospitals. The potential risk factors include the age and sex of donors and recipients, type of donor (living or deceased), familial relationship, hemoglobin level, blood groups of donors and recipients, duration of dialysis before transplantation (year), cold ischemic time (minute), creatinine level at discharge, body mass index (BMI) of donor (kg/m2), left or right kidney, type of immunosuppressive drugs used (imuran, prednisolone, and cyclosporine vs. CellCept, prednisolone, and cyclosporine), duration of hospitalization (number of days), volume of urine excretion during the first 24 hours after transplantation (mL/24 hr), and occurrence of acute or hyperacute rejection. Acute rejection is related to the formation of cellular immunity. This occurs to some extent in almost all grafts, except between identical twins, and hyperacute rejection is started by preexisting humoral immunity and usually manifests within minutes after transplantation. The response variable was having chronic nonreversible graft rejection [3].
2. Statistical Analysis
LR and ANN were used to analyze the dataset. To validate the results, the dataset (cases) was divided into training and testing sets. The ANN and LR models were first fitted to the training dataset (70% of cases), and the resulting models were evaluated using the test sample (30% of cases).
Logistic regression (LR): LR as a parametric method is the most common and easily interpretable tool to model binary or multinomial response variables. The model can be written as
In this model, the xi's are the covariates to classify the response, ╬▒ is the logarithm of odds when no covariates or factors are utilized to model the response variable, and the ╬▓i's are the regression coefficients. Predicting the probability of an event is the main advantage of logistic regression due to its modeling approach. The term ŽĆ 1 ŌłÆ ŽĆ  indicates the odds of classifying the response variable in category one than zero using several covariates and factors [10]. In the present study, we used the age and sex of donors and recipients, type of donor (living or deceased), etc. as covariates (Žć) and having chronic nonreversible graft rejection as the binary response. Thus, ŽĆ, is the probability of graft rejection.
indicates the odds of classifying the response variable in category one than zero using several covariates and factors [10]. In the present study, we used the age and sex of donors and recipients, type of donor (living or deceased), etc. as covariates (Žć) and having chronic nonreversible graft rejection as the binary response. Thus, ŽĆ, is the probability of graft rejection.Artificial neural network (ANN): This method is based on human brain function. Multilayer perceptron (MLP) is the most commonly used method among several artificial neural network methods. This method contains input, output, and hidden layers, where each layer includes several nodes. An activation function transforms the data in each layer to the next layer one by introducing a degree of nonlinearity. The input layer consist of all risk factors affecting the result of graft rejection. The binary response variable of graft rejection shows up in the output layer with two nodes as the possible outcomes for graft rejection. To find the best performance of the network, complex nonlinear mapping between input and output layers is conducted using the number of nodes, which is determined empirically in the hidden layer [14]. In MLP, a nonlinear activation function is applied by neurons to compute its outputs. In the present study, an ANN approach with one hidden layer was used (because increasing the number of hidden layers, despite the ability to consider much more complex relationships between variables, did not improve the performance of the method). A hyperbolic tangent was used as the activation function (f(Žć) = 2 / (1 + exp(ŌłÆ2Žć)) ŌłÆ 1) for the hidden layer as well as softmax (f i x = e x j Ōłæ i = 1 P e x i , ŌĆäj = 1 , ŌĆäŌĆ” , ŌĆäp ,  where xi's are predictor variables) in the output layer. The functional form of MLP is written as
where xi's are predictor variables) in the output layer. The functional form of MLP is written as
In the above equation, xi is the ith nodal value in the preceding layer, and yk is the kth nodal value in the current layer. In addition, bj and wji are the bias and a weight connecting xi and yj of the jth node, respectively, and N is the number of nodes (in the previous layer). The activation function in the present layer is f. We also provided the variable importance to identify the most important variables for graft rejection. Variable importance can be calculated in different ways. Here, the definition of variable importance is the relative reduction in the predictive power (calculated with some criteria) of the model. In the present study, the mean decrease Gini was used to calculate variable importance, which is a measure calculated based on the Gini impurity index. The Gini impurity index is utilized to calculate splits during training. For making a split in a node on a variable, say m, the Gini impurity criterion (for the two descendent nodes) will be less than that of the parent node. The Gini impurity index is calculated using G = Ōłæ i = 1 n c p i 1 ŌłÆ p i ,  where nc shows the number of classes in the output variable, and pi stands for the ratio of this class.
where nc shows the number of classes in the output variable, and pi stands for the ratio of this class.3. Evaluation Criteria
The performance of the models was compared in terms of several measures, including sensitivity, specificity, positive predicted value, negative predicted value, accuracy and area under ROC curve (AUC). Any statistical differences in the resulting proportions obtained by the models was assessed by McNemar's test. To assess the association between the observed and predicted values, several statistics were measures, such as ╬” coefficient, Kendall tau-b, and kappa statistic.
III. Results
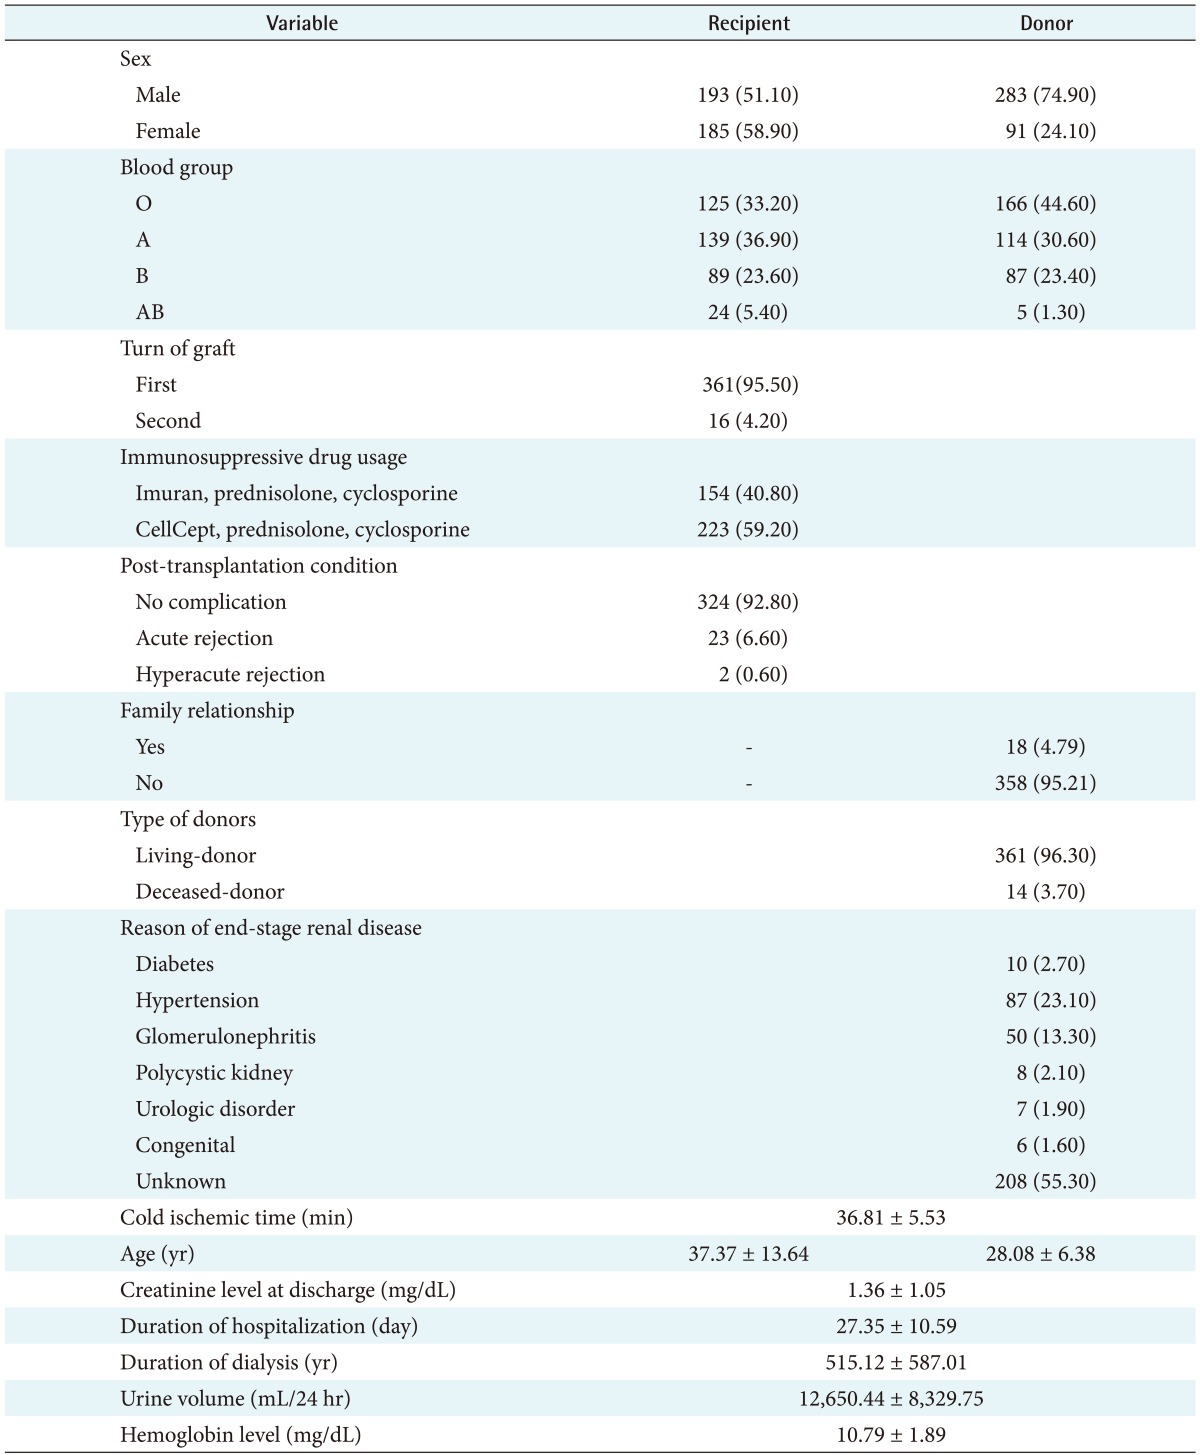
The information of 378 patients was used in the present study. The characteristics of the study subjects are shown in Table 1. About 51.3% and 74.9% of recipients and donors, respectively, were male. The recipients' ages ranged from 8 to 72 years, and the donors ages ranged from 13 to 62 years. The majority of recipients and donors were in A and O blood groups (36.8% and 44.2%) respectively. Also, 59.3% were treated with CellCept, prednisolone, and cyclosporine, and 95.8% were first grafts. In 45.5%, the cause of end-stage renal stage was unknown; 85.7% had no complications; 94.7% familial relationship; 95.8% had living donors; and 90.7% utilized a left donor kidney.
To identify the risk factors affecting failure of transplantation, LR and ANN were performed. The testing and training samples were composed of 114 (30%) and 264 (70%) cases, respectively.
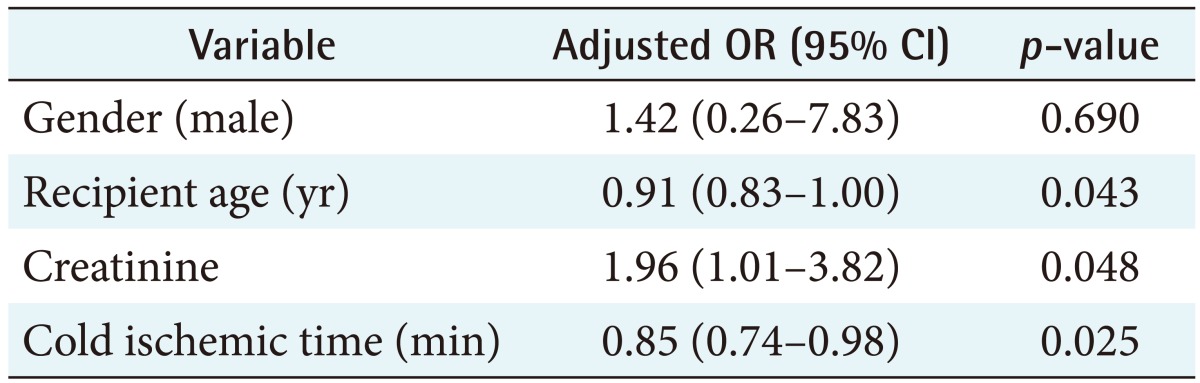
The results obtained by logistic regression are shown in Table 2. Using a stepwise variable selection method, important variables were determined using the training sample. The effects of selected variables on failure of transplantation were then assessed using the test sample. According to the results, the odds ratio of experiencing failure for males was 1.42 times greater than that of for females. The odds ratio for 1 year increase in recipients' age compared to the previous year was 0.91. In addition, the odds ratio for 1 mg/dL increase in creatinine was 1.96. Moreover, the odds ratio of successful transplantation by 1 minute increase in cold ischemic time was 1.17.
The importance of the variables is revealed by scores resulting from the sensitivity analysis. Similar to the outputs of LR and based on the shown importance of variables resulting from ANN in Figure 1, the most important variables in descending order are cold ischemic time, creatinine, recipients' age, and hemoglobin at discharge. These variables scored over 50% for normalized importance.
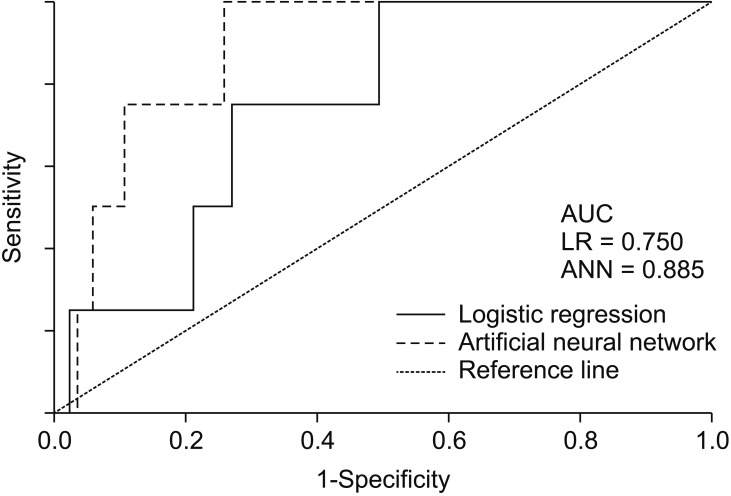
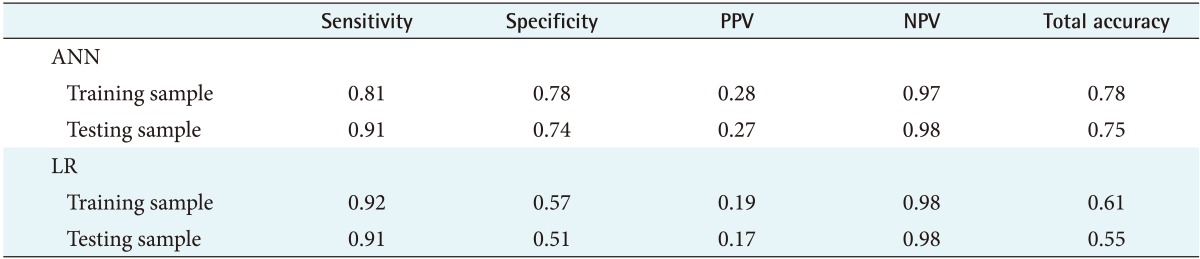
A comparison of sensitivity, specificity, positive probability value, negative probability value, accuracy, and AUC for the training and testing sets of classification methods are shown in Table 3. McNemar's test resulted in differences between the proportions for the two methods (p < 0.001). A higher accuracy was achieved by the ANN method in comparison to LR. To evaluate the association of the method predictions and observed value of failure, ╬” coefficient, Kendall tau-b, and kappa statistic were performed. The results shown in Table 4 confirm that there is a significant association and agreement of the performed methods with the observed values. Figure 2 demonstrates that ANN outperforms LR due to its higher AUC.
IV. Discussion
The life expectancy of patients with end-stage renal disease has been extended by the wide availability of alternative treatments [15]. Kidney transplantation is the treatment of choice for these patients [2223]. Several studies have been carried out to identify the potential prognostic factors of graft rejection [3516]. However, we tried to utilize data mining techniques to identify important risk factors. Our results showed that the variables of cold ischemic time, recipient's age, and creatinine level at discharge, selected by both LR and ANN, were important factors in the risk of graft rejection. This finding is consistent with the results of some other studies [17181920]. Cold ischemic time is a potential risk factor, involved in immediate anemia in renal transplant recipients [19]. In addition, as a recipient's age increases, the probability of acute rejection decreases, which may be due to stronger and more efficient immune systems in younger people [3]. Previous studies confirm this finding as well [2021]. Creatinine level at discharge was another important variable with increasing effect on the probability of kidney transplant rejection, which is consistent with the results of previous studies [522]. Moreover, hemoglobin level (mg/dL) was another important risk factor selected only by ANN. Other studies confirm this finding [2324].
This study focused on the performance of the ANN method in identifying potential risk factors for kidney graft failure in comparison to the performance of LR. The results showed that ANN achieved better performance. The evaluation criteria, such as AUC and accuracy, showed that the predictions made by ANN were more precise than those made by LR. Several studies have exposed and compared the power of predictions made by various classification methods. In 2014, Lin et al. [25] evaluated predictive models for preoperative diagnosis of rotator cuff tear. They compared ANN and LR and found that ANN achieved a higher predictive accuracy than LR. In 2012, Shi et al. [26] compared the performance of ANN and LR models in predicting in-hospital mortality after primary liver cancer surgery. They found that the ANN method was highly accurate and performed better than LR. Also, Chen et al. [27] assessed the performance of ANN and LR models to distinguish lung nodules on CT scans. Based on their study, ANN outperformed LR in both discrimination and clinical usefulness. In addition, Tapak et al. [28] assessed the performance of ANN and LR to identify important risk factors of diabetes and found that ANN outperformed LR in terms of AUC. Therefore, ANN can be applied successfully for identifying risk factors of the rejection of kidney transplantation. Lau et al. [29] evaluated the utility of machine learning algorithms, including ANNs, to predict kidney transplantation rejection after liver transplantation based on some known important variables. However, no comparison with LR was conducted. According to their result, ANN showed promising performance in the prediction of transplant rejection after liver transplantation.
ANN has some advantages and disadvantages in comparison to LR. For example, less formal statistical training is required for the development of neural network models. In addition, they can implicitly detect complex nonlinear relationships between independent and dependent variables and have the ability to detect all possible interactions between predictor variables. On the other hand, neural networks are a ŌĆśblack boxŌĆÖ and have limited ability to explicitly identify possible causal relationships, and they require greater computational resources [22].
There were some limitations in the present study. We utilized a dataset of a retrospective cohort study and medical records. Reliable sources of data, obtained from prospective design, were required to identify prognostic factors of rejection. The quality and accuracy of estimates depend mainly on the quality of recorded data, but it was not possible to verify the accuracy of the data used in the present study. This might have introduced some bias in the results. There are also several data mining techniques that have been used to predict graft kidney rejection [1330]. It would be useful to conduct a comprehensive study to compare all these methods over several datasets and use numerical and mathematical methods to investigate their performance in the prediction of kidney transplant rejection. Another point that should be considered is that, statistically, it is better to compare methods over several datasets or, at least, to repeat the process of extracting training and testing sets 100 times to see if one method outperforms others. In the present study, we found the results over one repetition to be comparable with the results of other studies. In addition, another limitation was that other data sources were not available.
In conclusion, our study showed that cold ischemic time, creatinine, recipients' age and hemoglobin at discharge are the most important variables affecting failure of transplantation. ANN was compared to LR and was found to be an accurate and promising method for the classification, prediction, and identification of important risk factors in various diseases.