Development and Validation of Web-Based Nomograms to Predict Postoperative Invasive Component in Ductal Carcinoma in Situ at Needle Breast Biopsy
Article information
Abstract
Objectives
Although sonography-guided core needle biopsy is a highly targeted method, there is a possibility of an invasive component after surgical excision of ductal carcinoma in situ (DCIS) of the breast. This study was performed to develop and validate nomograms to predict the postoperative invasive component in DCIS at core needle biopsy.
Methods
Two nomograms were developed using the data of previous meta-analysis and multivariate analysis. Nomograms were validated externally using the data of the authors' affiliation. The accuracy was validated by the expected-to-observed ratio and the Hosmer-Lemeshow goodness-of-fit test. Discrimination was validated by the area under the curve (AUC) of receiver operating characteristic (ROC) curve analysis.
Results
The nomogram using the meta-analysis study data was developed at http://dcis-m.surgery.kr.pe/, and the nomogram using the multivariate analysis study data was developed at http://dcis-k.surgery.kr.pe/. The Hosmer-Lemeshow goodness-of-fit test showed that the nomogram using multivariate analysis data (p = 0.131) was better calibrated than that using meta-analysis data (p < 0.001). ROC curve analysis showed statistically significant power of discrimination in both nomograms (AUC = 0.776, 0.751).
Conclusions
Both nomograms showed statistically significant discriminatory power, but the nomogram using the data of multivariate analysis was simpler and more reliable. These would be useful for the prediction of invasive cancer and the need for sentinel node biopsy in DCIS at core needle biopsy.
I. Introduction
Sonography-guided core needle biopsy is a standard tool for the diagnosis of breast cancer including ductal carcinoma in situ (DCIS). However underestimation is possible because only a small part of the tumor is sampled. After complete excision, the invasive component can be found in the final pathologic diagnosis of DCIS. In the case of a postoperative diagnosis of invasive cancer, additional axillary biopsy is needed because axillary metastasis is possible. Therefore, in cases in which the risk of invasive cancer is high, simultaneous axillary biopsy with surgery of the primary tumor can avoid the need for additional surgery.
There have been many studies on the prediction of postoperative invasive cancer in the case of preoperative DCIS. The meta-analysis of 52 studies of DCIS at core needle biopsy showed that symptomatic presentation, palpability, size, mammographic mass, Breast Imaging-Reporting and Data System (BI-RADS) category, biopsy method, and histologic grade were significant factors in the underestimation of DCIS [1].
In this study, we developed two Web-based nomograms to predict the postoperative invasive component in DCIS at core needle biopsy using the existing references of a meta-analysis study [1] and a multivariate analysis study [2] and compared the two nomograms in terms of validation of reliability and discrimination using the data of the authors' affiliation.
II. Case Description
1. Estimation of Model using Existing References
A nomogram was developed by using a multivariate linear logistic regression model. The regression coefficient (β) was calculated using the odds ratio (OR). The model was estimated as follows:
The two models were selected using data of the meta-analysis study [1] and the multivariate analysis study [2]. Selected meta-analysis study was the only study of that kind reported prior to the period of research, and we selected the largest Korean study among the many multivariate analysis studies. The risk factor selected were those that were statistically significant. The meta-analysis data [1] included a total of 7,350 cases of DCIS. Among them, 1,736 cases were diagnosed as invasive cancer finally. The model of meta-analysis study can be written as,
The multivariate analysis study [2] showed 216 cases of invasive cancer among 506 cases of DCIS. The model of the multivariate analysis study is given as
The probability of underestimation was calculated as in [3] as

2. Calibration of Regression Models using the Risk Intercept
The average rate of invasive cancer was 25.9% in the meta-analysis study and 42.7% in the multivariate analysis study. The rate of invasive cancer varied according to the target population; therefore, calibration of the model was mandatory. The risk intercept was defined as the rate of no risk factors divided by the rate of average risk factors. The rate of no risk factors was calculated as the summation of probability with no risk factors. The rate of the average risk was calculated as the summation of the probability × frequency of the risk factor combinations.

The intercept α was calculated as


3. Development of the Web-Based Nomograms
Each Web-based nomogram consisted of an HTML file which input the risk factors and a CGI file which calculated and output the results. The nomogram using the meta-analysis study data was developed at http://dcis-m.surgery.kr.pe/. The nomogram using the multivariate analysis study data was developed at http://dcis-k.surgery.kr.pe/. The default values of the average rate of invasive cancer were 25.9% in the meta-analysis data [1] and 42.7% for the multivariate analysis data [2] based on the references. Values of the average rate of invasive cancer were entered by input form and the values were modifiable. The output part included each OR according to the risk factors and the expected rate of invasive cancer.
4. Validation of the Nomograms
From January 2006 to June 2013, patients diagnosed as having DCIS by sonography-guided core needle biopsy were selected for the validation of the nomograms. The reliability of each nomogram was validated by comparing the expected number (E) with the observed number (O) of invasive cancers. The expected-to-observed (E/O) ratio was calculated according to each risk factor. Here, the 95% confidence intervals (CI) of the E/O ratio were calculated as

The correlation between the expected number and the observed number of invasive cancers was confirmed by the Hosmer-Lemeshow goodness-of-fit test. The discrimination of the nomograms was validated by the area under the curve (AUC) of receiver operating characteristic (ROC) curve analysis. We compared the two nomograms using MedCalc ver. 12.7 (MedCalc Software, Ostend, Belgium).
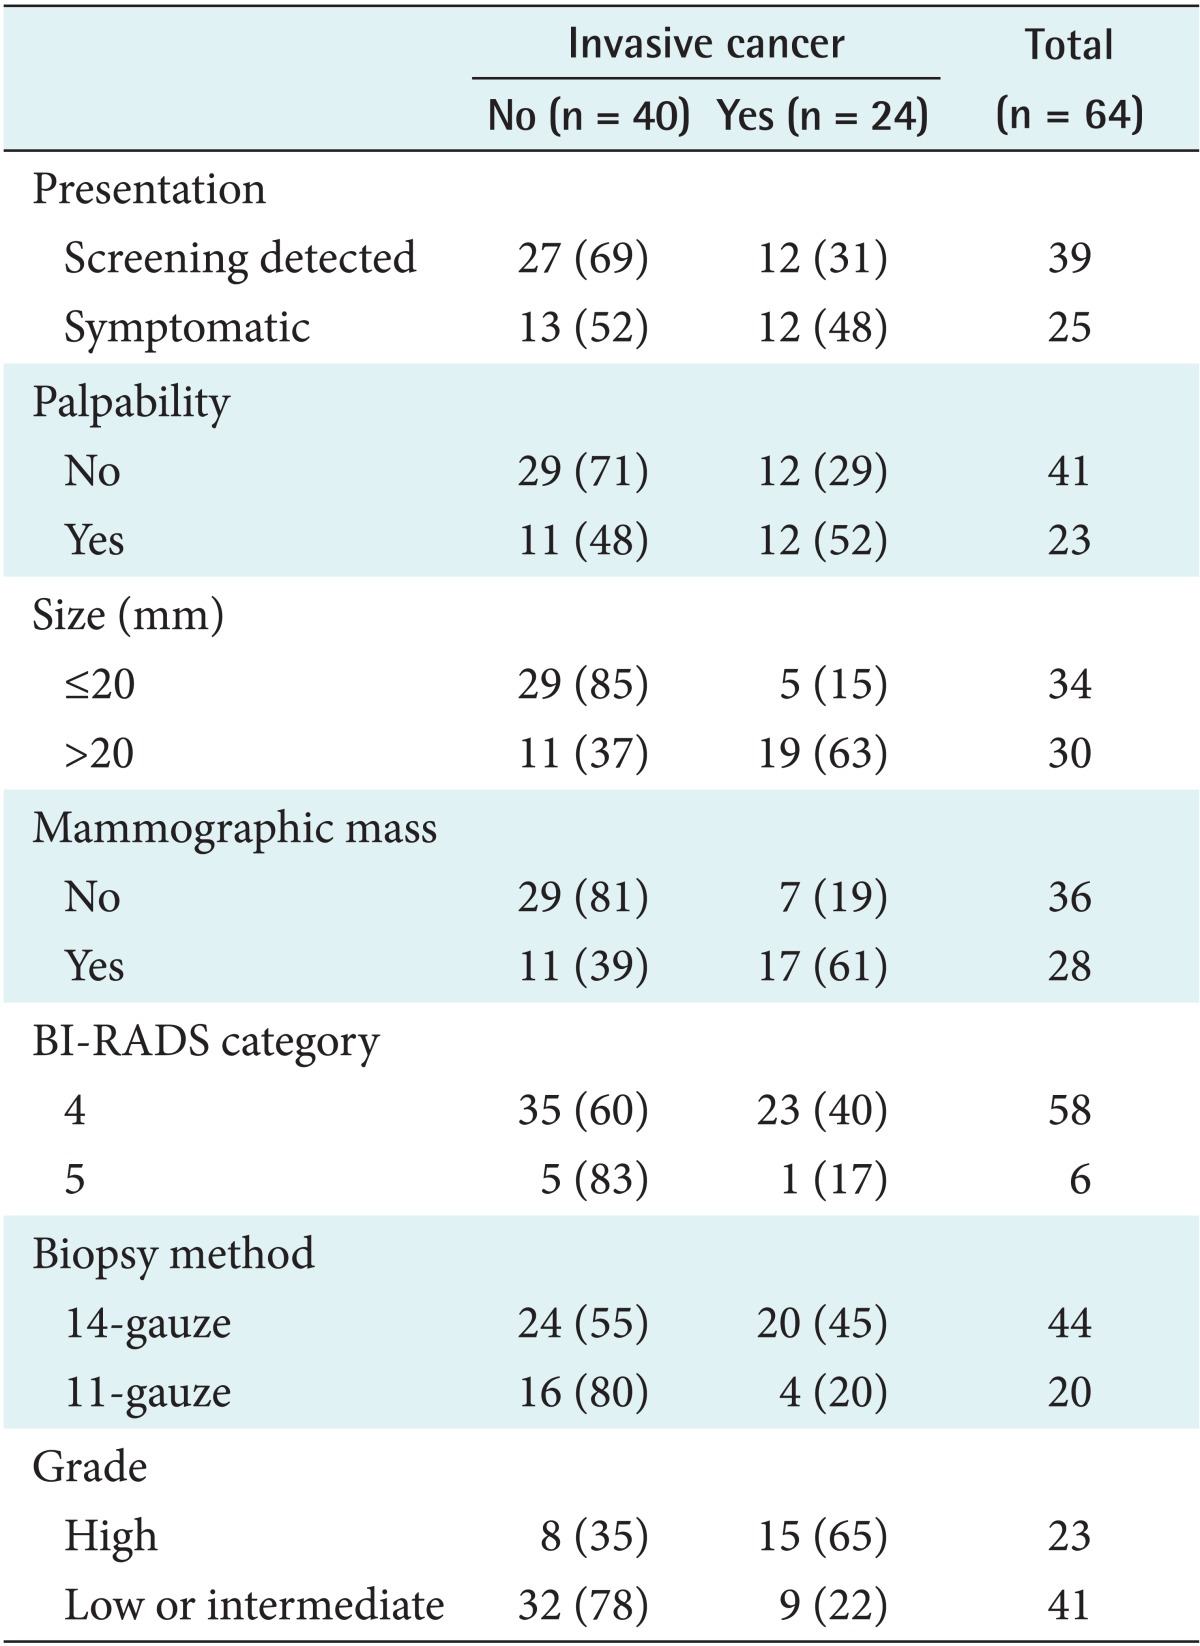
A total of 64 cases of preoperative DCIS were included in the validation data set. Among them, 24 cases (37.5%) were diagnosed as invasive cancer postoperatively, so we used 37.5% as the average rate of invasive cancer. The clinical, radiological, and pathological factors are summarized in Table 1.
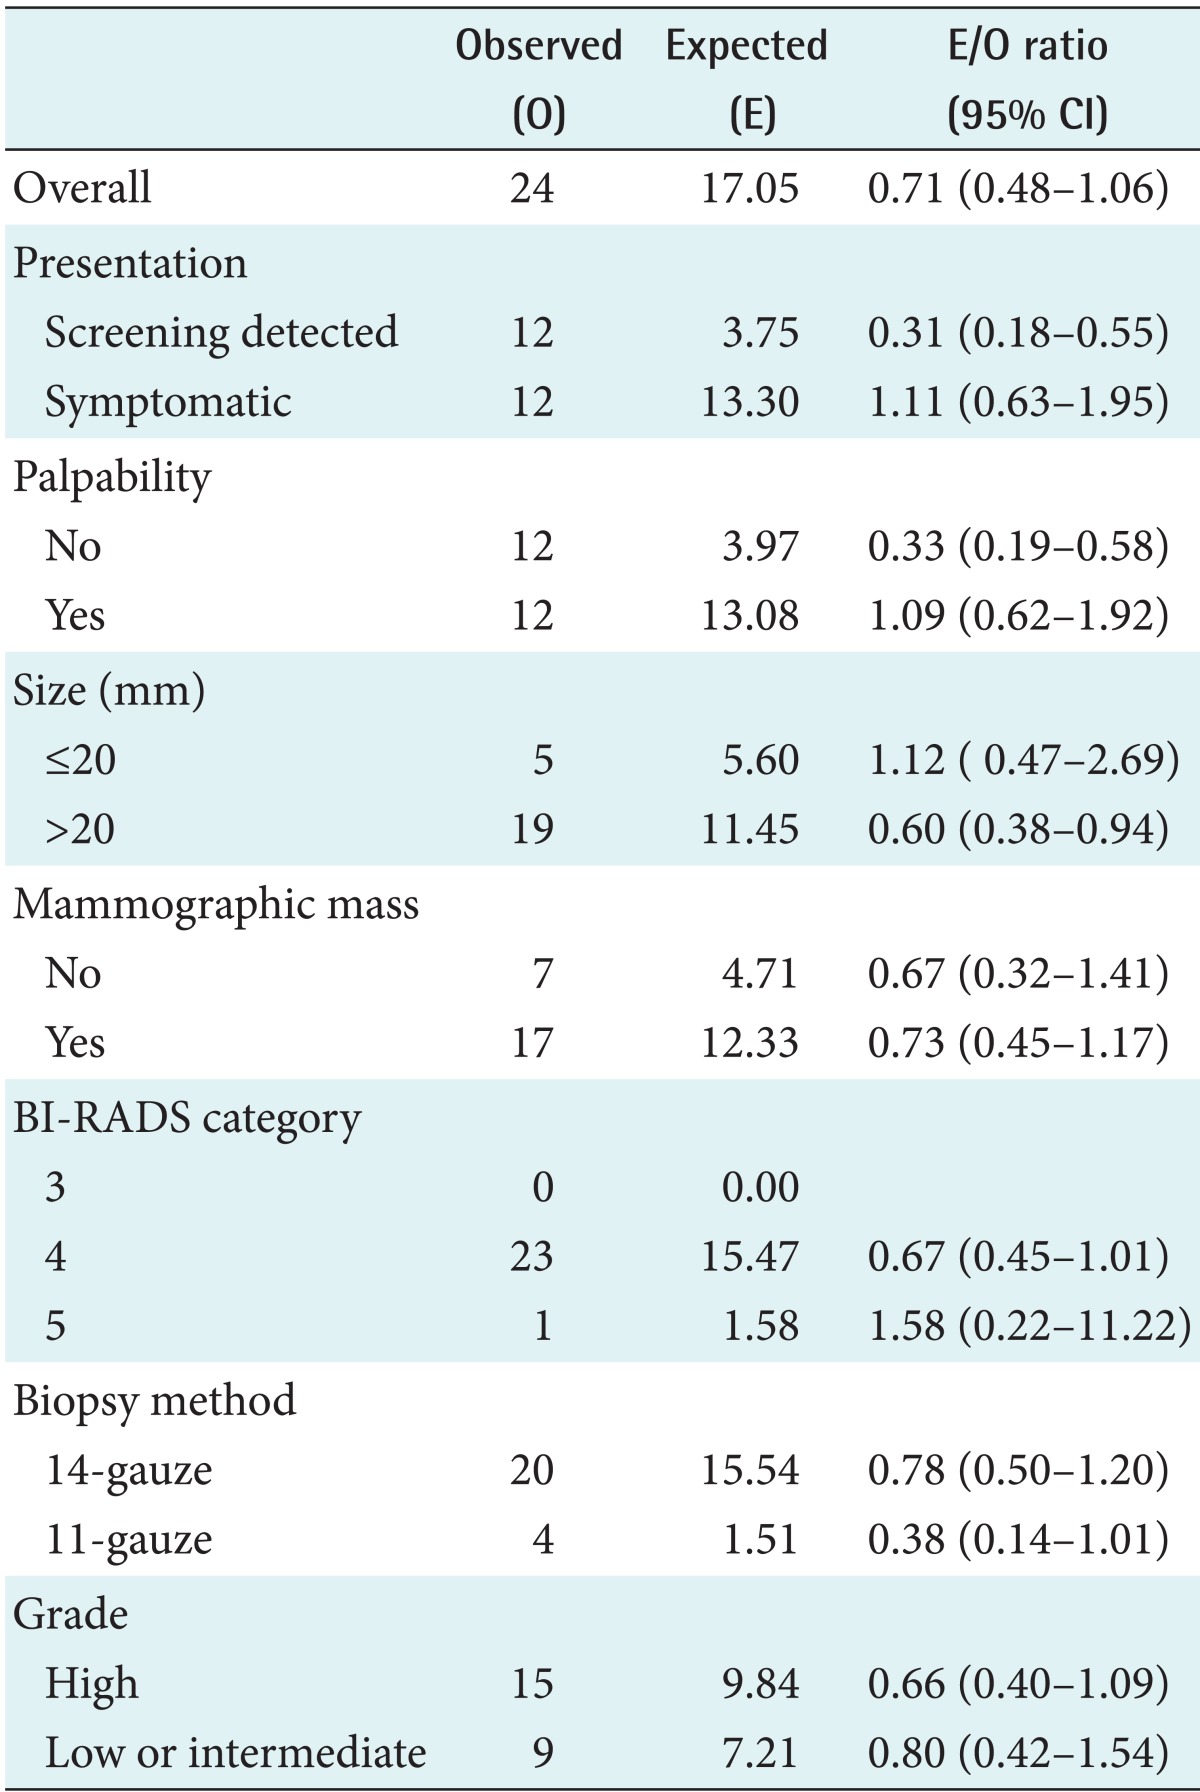
In Table 2, the E/O ratio and 95% confidence intervals are described from the nomogram using the meta-analysis study data. Overall, the nomogram showed a tendency of underestimation, but the tendency was not statistically significant. In the subgroup of screen detected, non-palpable mass, and size of more than 20 mm, the nomogram showed statistically significant underestimation.

Expected-to-observed ratio and 95% CI according to the factors of invasive cancer from the meta-analysis data
In Table 3, the same confidence interval was described from the nomogram using the multivariate analysis study data. Overall, it showed a tendency of overestimation, but the tendency was not statistically significant. In the subgroup of size less than or equal to 20 mm and low or intermediate grade, the nomogram showed statistically significant overestimation.

Expected-to-observed ratio and 95% CI according to the factors of invasive cancer from the multivariate analysis data
Figures 1 and 2 show the results of the Hosmer-Lemeshow goodness-of-fit test. The nomograms using multivariate analysis data (p = 0.131) showed better calibration than that using meta-analysis data (p < 0.001), so the nomogram using multivariate data was more reliable than the nomogram using meta-analysis data.

Hosmer-Lemeshow goodness-of-fit test of nomogram from the meta-analysis data (p < 0.001). Expected number of invasive cancer patients, observed number of invasive cancer patients, and the corresponding number of total patients per decile are shown.

Hosmer-Lemeshow goodness-of-fit test of nomogram from the multivariate analysis data (p = 0.131). Expected number of invasive cancer patients, observed number of invasive cancer patients and the corresponding number of total patients per decile are shown.
In the validation of discrimination power, the AUC of the nomogram using the meta-analysis study data was 0.766 (95% CI, 0.650-0.882; p < 0.001), while the AUC of the nomogram using multivariate analysis study data was 0.751 (95% CI, 0.628-0.873; p = 0.001). The ROC curves of both nomograms showed no difference in discrimination (p = 0.614) (Figure 3).
III. Discussion
In this study, we developed two nomograms: one using the ORs of a meta-analysis study and the other using the ORs of a multivariate analysis study. The results showed that the two nomograms achieve similar discriminatory power. However, the nomogram using the multivariate analysis data is simpler and more reliable than that using the meta-analysis data. This may be due to the correlations between factors. Meta-analysis is a univariate analysis, and prediction can be incorrect if factors correlate with each other. We confirmed that the nomogram using the meta-analysis data was more complicated and inaccurate.
A nomogram can be validated by both internal and external validation. Internal validation uses the data of the same population for the development of the nomogram, and external validation uses the data of a different population. In most studies, internal validation is performed first. However, most nomograms are used in populations that are different from the one that was used for the development of the nomogram; therefore, inaccurate results are possible. For example, nomograms developed in a western country showed decreased accuracy when applied to oriental people [4]. We used a different data set for the external validation, which showed significant reliability and discrimination in the nomogram using the multivariate study data; therefore, it would be possible to use it in clinical situations.
For more accurate prediction, we developed a nomogram with an intercept calibration and a changeable rate of postoperative invasive cancer. Showing great variety, the rate of postoperative invasive cancer has been reported in the range between 0% and 59% [1], and the rate varies according to each affiliation. Our nomograms can change the rate, and this should make accurate prediction more likely.
In conclusion, we developed two nomograms based on studies of meta-analysis and multivariate analysis. Both nomograms showed statistically significant discriminatory power, but the nomogram using the multivariate analysis data was simpler and more reliable. The nomogram using the multivariate analysis data would be useful for the prediction of invasive cancer and the need for sentinel node biopsy in DCIS at core needle biopsy.
Acknowledgments
This research was conducted by the research fund of Dankook University in 2014.
Notes
No potential conflict of interest relevant to this article was reported.

