Predictors of Medication Adherence in Elderly Patients with Chronic Diseases Using Support Vector Machine Models
Article information
Abstract
Objectives
The aim of this study was to establish a prediction model of medication adherence in elderly patients with chronic diseases and to identify variables showing the highest classification accuracy of medication adherence in elderly patients with chronic diseases using support vector machine (SVM) and conventional statistical methods, such as logistic regression (LR).
Methods
We included 293 chronic disease patients older than 65 years treated at one tertiary hospital. For the medication adherence, Morisky's self-report was used. Data were collected through face-to-face interviews. The mean age of the patients was 73.8 years. The classification process was performed with LR (SPSS ver. 20.0) and SVM (MATLAB ver. 7.12) method.
Results
Taking into account 16 variables as predictors, the result of applying LR and SVM classification accuracy was 71.1% and 97.3%, respectively. We listed the top nine variables selected by SVM, and the accuracy using a single variable, self-efficacy, was 72.4%. The results suggest that self-efficacy is a key factor to medication adherence among a Korean elderly population both in LR and SVM.
Conclusions
Medication non-adherence was strongly associated with self-efficacy. Also, modifiable factors such as depression, health literacy, and medication knowledge associated with medication non-adherence were identified. Since SVM builds an optimal classifier to minimize empirical classification errors in discriminating between patient samples, it could achieve a higher accuracy with the smaller number of variables than the number of variables used in LR. Further applications of our approach in areas of complex diseases, treatment will provide uncharted potentials to researchers in the domains.
I. Introduction
As the elderly population grows, the prevalence of aging-related diseases and drug expenditures has increased in Korea. The Korean population over age 65 was 11.0% of the total population in the year 2010, and is projected to be 14.3% by 2018 and 20.8% by 2026 [1].
Older adults that have various chronic diseases requiring polypharmacy often do not take medications as prescribed by their health care providers, with reported rates of noncompliance ranging from 40%-50% [2]. Medication non-adherence lowers the effectiveness of treatments and raises medical costs. Therefore, non-adherence is an important issue in the management of patients with chronic diseases.
Elderly patients' adherence to prescribed medications is a complex phenomenon that depends on an interaction of socio-demographic, medication, and psychological factors. In previous studies, factors attributed to non-adherence included access to medicines, polypharmacy, multiple morbidity [3], complexity of regimens [4], as well as poor communication between prescriber and patient. Numerous studies have explored the potential predictors of adherence to medications across a variety of conditions. However, little data is available regarding the decline in adherence over time and its associated risk factors. Recently, some studies have begun to explore more modifiable predictors of adherence, such as depression, medication knowledge, health literacy, and self-efficacy [5,6].
Predictive models are used in a variety of medical domains for diagnostic and prognostic tasks. An increasingly large number of data items are collected routinely, and often automatically, in many areas of medicine. It is a challenge for the field of machine learning and statistics to extract useful information and knowledge from this wealth of data [7].
The support vector machine (SVM) is a relatively new classification or prediction method developed as a result of the collaboration between the statistical and the machine learning research community.
Today, SVM has become an important issue, equal to the previous neural network algorithm in the machine learning field. Examples of applications using SVM include character recognition, voice recognition, face detection, document retrieval, image recognition, medical diagnostics, mortality prediction, and analysis of bioinformatics and genetics. SVM is used in many other areas.
The heuristic behind the SVM algorithm is quite different from that of the commonly used logistic regression (LR) modeling for prediction. The LR algorithm uses a weighted least squares algorithm. SVM, in contrast, tries to model the input variables by finding the separating boundary-called the hyperplane-to reach classification of the input variables by mathematically transforming the input variables [8].
In the classification problems, the LR and SVM were compared in several papers; SVM generally showed equal or superior performance than LR [7,9]. SVM is especially suitable for the analysis of large amounts of biomedical data that comprise a small number of records and a large number of variables [10].
In previous studies, classification algorithms and pattern analysis were mainly focused on Bayesian and artificial neural networks in the broad healthcare domain. To date, SVM has not yet been studied in terms of the prediction of medication adherence in elderly patients with chronic diseases in Korea or other countries. The current study was the first attempt to investigate the use of an SVM-based classification model for determining the predictors of medication adherence in elderly patients with chronic diseases.
The purposes of this study were to identify the factors influencing medication adherence and to compare the accuracy of LR- and SVM-based models in predicting medication adherence in elderly patients with chronic diseases.
II. Methods
1. Data Collection and Preparation
This cross-sectional descriptive survey was undertaken at outpatient clinics at a teaching hospital in Cheonan, Korea. We used sample data from January to May 2011 of 293 patients over 65 years of age with chronic disease. We included elderly patients who had been taking a medication for longer than 6 months and had asthma, hypertension, diabetes, chronic obstructive pulmonary disease, liver cirrhosis, stroke, and cardiovascular diseases with normal cognitive function. The study was approved by the ethics committee of the hospital prior to the start of data collection. Written consent was obtained. The questionnaire was verbally administered to consenting respondents who were unable to self-complete the survey.
Sixteen variables were used: age, gender, job, monthly income, spouse, educational level, activities of daily living (ADL), perceived health status, duration after diagnosis, number of medication types, daily pill counts, side effects of medication, self-efficacy, depression, health literacy, and medication knowledge. The variable sets used in this study are shown in Table 1.

Description of variables
2. Measurements
The questionnaire was designed to yield information about demographic characteristics such as age, gender, educational level, spouse, and monthly income. Depression was assessed by means of the short-form of the Geriatric Depression Scale (GDS), which is a validated 15-item, self-report depressive symptom scale designed to detect the presence of current depression in older adults [11] (Cronbach's α = 0.91). To assess patients' medication knowledge, we used five self-report questions using a 5-point Likert scale [12] (Cronbach's α = 0.79). Health literacy indicates an individual's ability to obtain and use health information to make appropriate decisions for health and medical care. For health literacy, patients were asked three previously described health literacy screening questions, each with five possible response options [13] (Cronbach's α = 0.81). Perceived health status refers to self-reported status, ADL and daily self-care capabilities at home and in outdoor environments, respectively. In this study, self-efficacy indicated a patient's belief in his/her ability to succeed in adhering to the prescription medication. We used a previously described medication self-efficacy system [14] using 13 items with good internal consistency reliability (Cronbach's α = 0.89).
Lastly, medication adherence was determined using a modified version of the four items, self-reported Morisky medication adherence scale [15]. Each item was in a yes/no format with each item is in a yes/no format with a maximum possible score of four equating very poor adherence and 0 or 1 typically considered as good adherence. The Morisky scale has been used across many chronic diseases, as a self-reported measure of adherence to medications and has demonstrated good reliability and predictive validity [16]. Scores ≤2 were considered indicative of non-adherence to medications.
3. Variable Selection
Sixteen variables were used in the model building and analysis. The variables were selected because they either had been shown to have an impact on medication adherence in previous research [17] or were of potential clinical importance as indicated by a panel of experts. The variables were gender, age, job, educational level, side effects of medication, depression, health literacy, monthly income, spouse, and duration after diagnosis, medication knowledge, number of medication types, daily pill counts, perceived health status, ADL, and self-efficacy. Patients were asked about medication adherence using a self-reported questionnaire. The dataset was divided in a group of 120 adherent patients and 173 non-adherent patients.
4. Comparison Between Prediction Models
The LR model building processes were carried out in SPSS ver. 20.0 (IBM, Armonk, NY, USA). A p-value ≤ 0.05 was considered to be significant for inclusion into the model. We checked multicollinearity to verify the adequacy of the regression model. The identified variation inflation factor (VIF) value of less 10 confirms the absence of collinearity (in the data). Moreover, the Durbin-Watson test for residual analysis showed a value of less than 2 (1.85), effectively demonstrating that there was no correlation between the error terms of the model, which subsequently satisfied the assumption of normal distribution of residuals. Therefore, it entailed that the data under study was suitable for regression analysis.
The SVM-based model building processes were carried out with MATLAB ver. 7.12 (MathWorks, Natick, MA, USA). We used SVM with radial basis function (RBF) as kernels.
Comparison of LR and SVM discrimination for both models was performed. Five widely used statistics were adopted to evaluate the performance of a model: sensitivity, specificity, positive predictive value (PPV), negative predictive value (NPV), and accuracy. To test the ability of each model to distinguish patients, the area under the receiver operating characteristic curve was calculated.
III. Results
1. General Characteristics of Patients
We used sample data of 293 patients with chronic disease (120 good adherence and 173 poor adherence results). The mean age of the patients was 73.8 years. Table 2 shows the socio-demographic and clinical characteristics of the patients.

Socio-demographic and clinical characteristics of the 293 patients
2. Development of the Logistic Regression Model
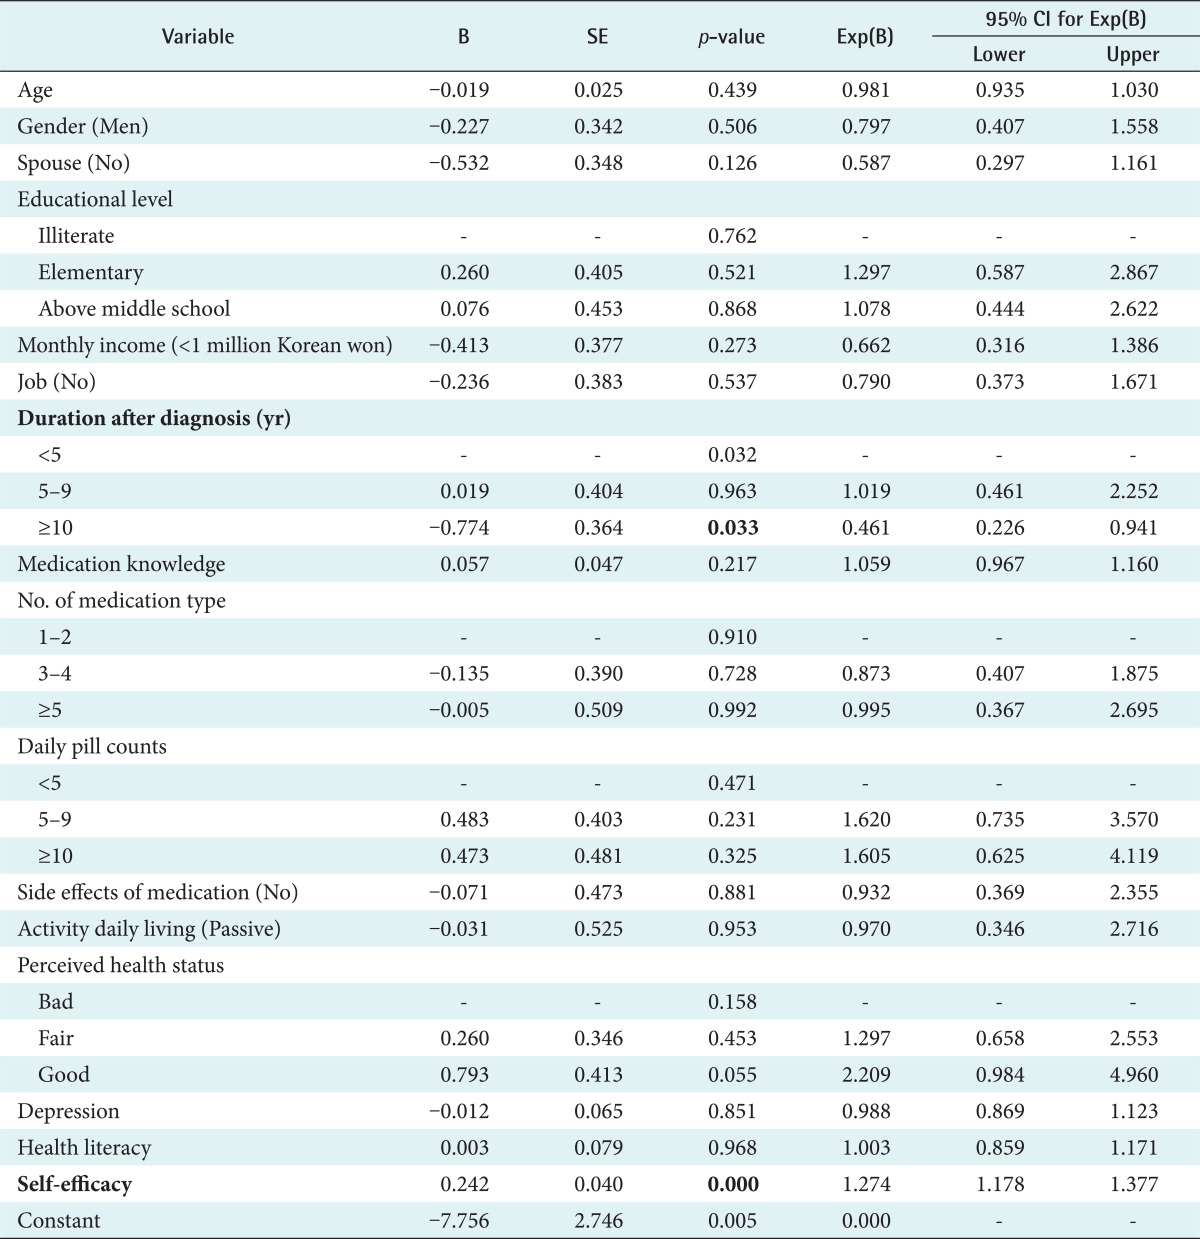
Taking into account the 16 variables, the results of applying LR accuracy was 71.1%. Duration after diagnosis and self-efficacy are selected as significant variables in the LR model. The medication adherence rate of patients with duration after diagnosis of more than 10 years was 46% lower than those with duration after diagnosis of less than 5 years. For every unit higher in the self-efficacy score, the medication adherence rate rose by 27%. A complete list of study variables in each variable set along with p-values are listed in Table 3.
Logistic regression model
3. Development of the SVM
To examine the characteristics of the patient samples with good and poor prognoses before performing the SVM experiments, we applied Principal Component Analysis (PCA). PCA transforms original features in a multivariate data set into salient features that are not correlated with each other [18]. Therefore, the original features, representing the patient sample, can be reduced to a smaller number of new features, referred to as the principal components (PC). The largest variance for the data set is set as the first axis (the first PC) in the coordinate system. Likewise, the second greatest variance is set as the second axis (the second PC), and so on. Applying PCA to the 16 features of the 293 patient samples, we could project the patients onto a three-dimensional space composed of PCs 1, 2, and 3. Figure 1 illustrates the distribution of the patient samples on this coordinate. From this figure, we expected to develop a SVM classifier that distinguishes the patients with good and poor samples.
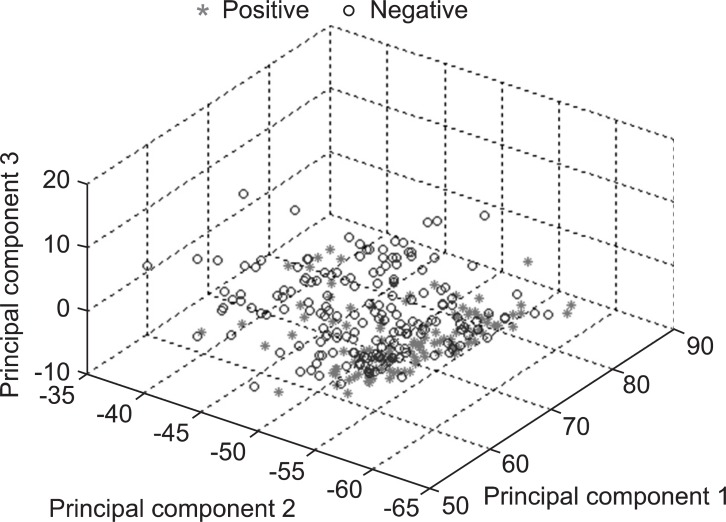
The Principal Component Analysis plot of 293 samples (stars represent good adherence and circles represent poor adherence).
To identify the variables that had the highest classification accuracy in medication adherence for chronic disease, we developed SVM with radial basis function (parameter C = 1, γ = 1/number of features) that systematically searched through the space of subsets of variables, and evaluated the goodness of each variable subset according to the prediction accuracy. The variable subset showing the highest accuracy was identified as the predictor set. Parameter C is the weights between empirical error and generalization error. Parameter γ controls the shape of the separating hyperplane.
Although an exhaustive enumeration search of variables can find an optimal solution, it requires extremely high computational cost to train and test SVM with each subset of variables. Thus, we employed sequential forward selection (SFS) search to deal with this difficulty [19]. The SFS is a heuristic greedy search that starts from an empty set of variables, sequentially selecting a variable.
We listed the top nine ranked variables selected by SVM and their prediction accuracies using a combination of the top ranked variables together in Table 4 to examine the above results in detail. The accuracy using a single variable selected was 72.4%; self-efficacy was selected, as in the LR model. The present accuracy of the SVM reached 83.3% with two variables, self-efficacy and age. The highest accuracy, 97.3%, was achieved with nine predictors: self-efficacy, age, depression, health literacy, medication knowledge, number of medication type, daily pill counts, duration after diagnosis, and education level.
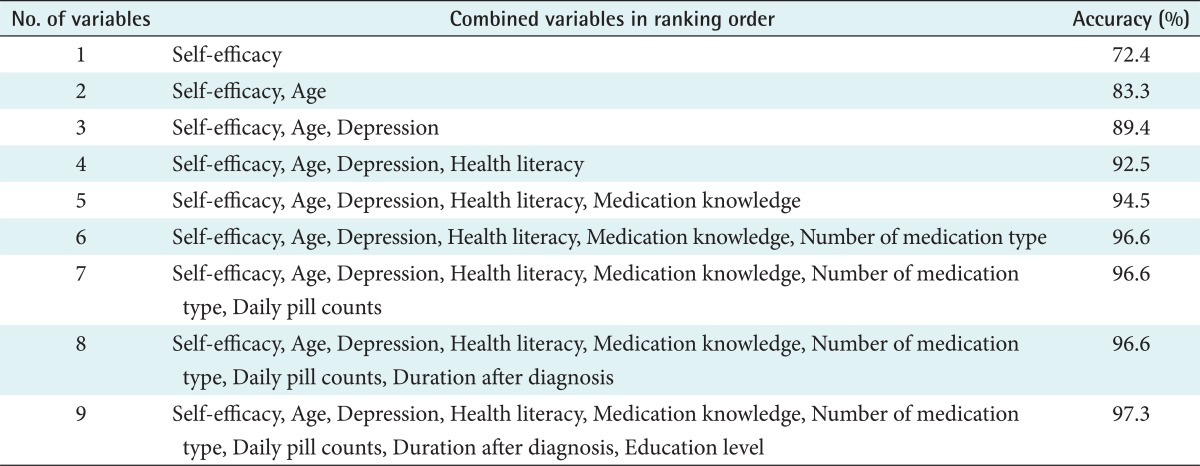
Combination of the top nine variables and classification accuracy
Figure 2 shows the prediction accuracy when all 16 variables were used for the prediction of medical adherence in the order of variables selected by SVM. The performance was very markedly decreased when more than 10 features were selected. Unlike our intuition that having more variables should give higher predictive performance, this example demonstrates that using a small number of variables can achieve higher prediction accuracy.
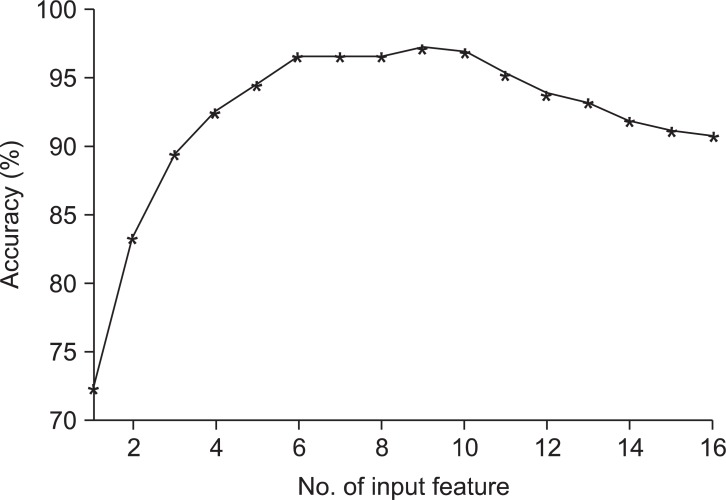
Classification accuracy for the 293 patients achieved with support vector machine (SVM) according to the number of input variables.
4. Comparison Between Prediction Models
Table 4 compares the experimental results of LR and SVM using five evaluation measures. SVM showed better performance than LR in overall scoring categories, allowing identification of predictor candidates to determine the most probable medication adherence of a patient.
LR showed 71.1% accuracy when all 16 variables were used for the prediction of medical adherence (Tables 3 and 5). Compared to the result of LR, the result of SVM showed significantly higher accuracy, 97.3%, with only nine variables on the same patient samples (Table 5). This result indicates that SVM can achieve greater accuracy with a smaller number of variables than the number of variables used in LR. It is interesting to note that the most significant variable (self-efficacy) selected by the SVM agrees with that selected by LR. When even a single variable (self-efficacy) was used by SVM, 72.4% accuracy could be achieved, which is higher than that achieved using all variables by LR.

Comparison between LR and SVM
The results of the comparison of the discriminatory power of LR and SVM models are summarized in Table 5.
The AUC indicates how well a prediction model discriminates between healthy patients and patients with disease. The following guidelines have been proposed for interpretation of this area: 0.5-0.7, rather low accuracy; 0.7-0.9, moderate accuracies useful for some purposes; and >0.9, rather high accuracy [20]. Therefore, the classification accuracy of these models was good.
Our results indicate that the SVM model has better diagnostic capability than LR model. The AUC has achieved a good diagnostic power. Figure 3 shows the performance of the two models built.

Area under the receiver operating characteristic curve (AUC) of the logistic regression (LR) and support vector machine (SVM) models.
IV. Discussion
Medication adherence is a complex phenomenon with many causes and correlates. In this analysis, self-efficacy was revealed as the strongest predictor of medication adherence. These findings suggest that providing clear instructions and responding to questions may increase patient confidence and knowledge, while enhancing their willingness to follow the treatment plan. Simple counseling strategies described in the literature on health behavior change can enhance provider skills in building confidence and motivating patients [12]. Also, in this study, the number of medication types, daily pill counts, and duration after diagnosis were associated with medication adherence in the SVM model. Those who took more medicines were more adherent. This finding contradicts the common medical dictum that more medicines lead to poorer adherence. However, other studies have had similar results [21,22]. Shalansky and Levy [21] found that patients in long-term treatment for cardiac disease had better adherence with more prescriptions. However, when multiple drugs are clinically indicated, one can be cautiously optimistic about a patient's ability to adhere to treatment, given appropriate instruction and support.
Other predictors such as age, health literacy, education level, and medication knowledge were significantly related to medication adherence in elderly patients with chronic disease. Especially, health literacy is the ability to obtain, process, and understand health information to make appropriate health decisions [23]. Studies in various patient populations demonstrate an association of limited health literacy with poorer health-related knowledge including medication knowledge. Also, health literacy was associated with older age and educational level [23,24]. Therefore, a broader understanding of these relationships will facilitate the development of targeted interventions to improve medication adherence, quality of care, and outcomes in patients with chronic disease.
Also, we found that depression was associated with medication non-adherence in elderly outpatients with chronic disease. Ziegelstein et al. [25] reported that depression was associated with taking less prescription medication, but it was unclear whether the frequency of "taking prescription medication" was measuring adherence or the number and frequency of medications prescribed.
The current study has several limitations, which have to be improved for prospective studies in prediction modeling. First, in this study, self-reported adherence was assessed once and not longitudinally. Further studies should explore the use of multiple adherence assessment method like provider's report and the Morisky medication adherence scale, which could be compared and aggregated to get a single adherence estimate.
Second, the previous study of Son et al. [26] reported that the medication knowledge variable was an important predicator of medication adherence in heart failure patients. Self-efficacy and medication knowledge have important implications for clinical care quality. In future studies, we need to study how they affect predictability by identifying the meaning and the scale level of the variables that are important predictive factors. In-depth studies about feature normalization, discretization, factor analysis, and detailed univariate analysis will be needed.
Third, the cross validation method used the same data as the test data and the training data for this study, so a higher classification rate than the actual rate can be seen. Thus, future studies will be able to get more accurate results by ensuring that the test data and the training data are separated in advance. In further research, if there are many samples, we may have to consider other ways such as 10-fold cross validation, leave-one-out cross-validation, (LOOCV) etc.
To our knowledge, ours is the first study to examine the association between socio-demographic factors, medication, clinical factors, and psychosocial factors, including depression, health literacy, medication knowledge, and self-efficacy and medication non-adherence in patients with chronic disease using SVM models. The knowledge of these predictors will also inform the development of interventions which target a higher-risk subset of older patients with chronic disease.
Furthermore, SVM showed higher classification accuracy than LR, because it establishes the optimal classifier to maximize the geometric margin between samples and therefore minimize empirical classification errors. We expect that SVM will serve as an effective alternative to conventional LR in identifying the key variables to show the highest classification accuracy, thereby creating a valuable diagnostic program for medication adherence prediction.
The research is not finished when a good model is found; the model must be included within some clinical information or decision support system. If possible, a cost or benefit study should also be done.
Acknowledgments
An abstract of this study was presented with a poster in 2012 KOSMI Spring Conference.
This work was supported by the National Research Foundation of Korea (NRF) grant funded by the Korean government (MEST) (2010-0025461).
Notes
No potential conflict of interest relevant to this article was reported.