Quantitative Measurement Method for Possible Rib Fractures in Chest Radiographs
Article information
Abstract
Objectives
This paper proposes a measurement method to quantify the abnormal characteristics of the broken parts of ribs using local texture and shape features in chest radiographs.
Methods
Our measurement method comprises two steps: a measurement area assignment and sampling step using a spline curve and sampling lines orthogonal to the spline curve, and a fracture-ness measurement step with three measures, asymmetry and gray-level co-occurrence matrix based measures (contrast and homogeneity). They were designed to quantify the regional shape and texture features of ribs along the centerline. The discriminating ability of our method was evaluated through region of interest (ROI) analysis and rib fracture classification test using support vector machine.
Results
The statistically significant difference was found between the measured values from fracture and normal ROIs; asymmetry (p < 0.0001), contrast (p < 0.001), and homogeneity (p = 0.022). The rib fracture classifier, trained with the measured values in ROI analysis, detected every rib fracture from chest radiographs used for ROI analysis, but it also classified some unbroken parts of ribs as abnormal parts (8 to 17 line sets; length of each line set, 2.998 ± 2.652 mm; length of centerlines, 131.067 ± 29.460 mm).
Conclusions
Our measurement method, which includes a flexible measurement technique for the curved shape of ribs and the proposed shape and texture measures, could discriminate the suspicious regions of ribs for possible rib fractures in chest radiographs.
I. Introduction
The detection of rib fractures is of utmost important to detect associated injury, to prevent complication, to obviate medico legal issues, to detect pathologic fractures, and to help manage patients' pain. Currently, various imaging techniques are employed, such as plain radiography, computed tomography, bone scanning, and ultrasonography, to diagnose possible rib fractures. However, plain radiography is the most commonly used imaging tool to detect rib fractures, because of its economic and clinical benefits [1]. The accuracy for detecting rib fractures of chest radiographs depends on the observer's training level, the quality of displayed images, and the clinical scenario for which chest radiographs are obtained. A previous investigation reported that plain radiography alone can miss up to 50% of rib fractures [2].
Currently, most display systems for digital radiographs import image processing methods [3-5] to reduce image noise and enhance the contrast of structures in images. These enhancement techniques have substantially improved the image quality of chest radiographs in depicting anatomical structures, but the techniques do little to improve image quality of the thoracic skeletal system for rib fracture diagnosis. As a result, clinicians can spend more interpretation time to detect rib fractures from the '24 ribs' which are long and overlap each other. To enhance the accuracy of rib fracture diagnosis and to reduce the miss-rate and the interpretation time, a computer-aided method which suggests suspected regions of rib fractures to radiologists is expected to play an important role.
In earlier studies on computer-aided bone fracture detection, an automatic fracture detection method was proposed for long bone radiographs [6]. The detection method involves long bone edge approximation using the modified Hough transform and a suspected region computation using image gradient and the extracted line information. Fracture detection techniques using support vector machine (SVM) based on texture features, such as Gabor orientation or intensity gradient, were also proposed for femur radiographs [7,8]. Recently, a vertebra crack detection method on plain radiographs using region-splitting by means of a fuzzy index measure was proposed [9]. However, these methods are difficult to apply in rib fracture detection, because ribs have different characteristics from other bone structures in chest radiographs. First, ribs have various curved shapes which are changed by the patient's posture, photographing regions, and photographing directions. Moreover, rib fractures are observed from various regions of the ribs on the chest radiograph. To the best of our knowledge, quantitative image analysis [10] of the shape and texture characteristics of broken ribs has not been explored. In this paper, we propose a quantitative and flexible measurement method extracting the shape and texture features of ribs from chest radiographs devised to detect rib fractures. We also present the statistical analysis results of our measurement method at the sites of rib fractures and at those of non-fractures with the radiographs of rib fracture patients.
II. Methods
1. Materials
For this retrospective study, the radiology information system (RIS) was used to search for patients with reported rib fractures in digital posterior-anterior (PA) chest radiograph images taken from July 1, 2009 to December 31, 2010 in Gangnam Severance Hospital. This study considered 18 chest radiographs of 18 rib fracture patients in various clinical scenarios, such as visits to the emergency department due to blunt trauma, care in the intensive care unit, and so on. The patient ranged in age from 30 to 81 years (mean age, 53.4 ± 14.7 years), and they included 13 males and 5 females. The chest radiographs for the experiments consist of three PA view images, six right oblique view images, and nine left oblique view images, in which the rib fractures were observed clearly. Every chest image that showed at least one broken rib was collected and provided by a radiologist, and the broken parts of ribs were identified by the radiologist prior to image processing and analysis procedures.
To reduce the image noise and emphasize the shape of ribs on the chest radiographs, we applied an unsharp masking method to enhance the contrast nonlinearly with several low frequency band-pass images of various scales. The low-frequency band-pass images are generated by convolution with Gaussian kernels, and the high frequency band-pass images are obtained by subtracting the blurred images from the former images.
2. Adaptive Measurement Area and Sampling using Spline
Assigning an appropriate measurement area for rib fracture detection is an important step to minimize the measurement target from a whole image to a rib and to obtain the comparable values used to discriminate the abnormalities of each rib. As ribs have curved shapes of various sizes in chest radiographs, we implement an area assignment technique outlining the curved boundaries of each rib smoothly with a cardinal spline and a thickness input. The spline represents the centerline of a rib, and the thickness value determines the volume of the measurement area along the centerline (Figure 1A).
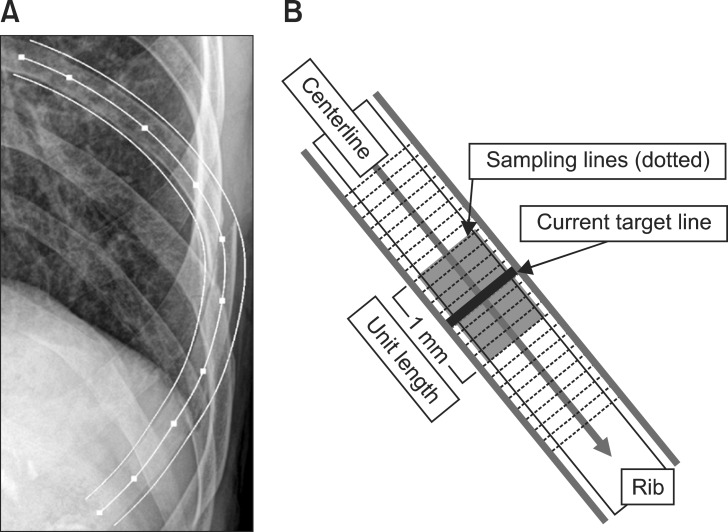
(A) Measurement area assignment using a spline and a thickness value. (B) Fracture-ness measurement process on a single rib.
The measurement area is sampled with many lines orthogonal to the centerline specified by the spline. The pixel values of each sampling line are normalized by subtracting the weighted average pixel value of each line from the pixel values of the lines and rescaling the pixel values linearly into the range of [0, 255]. The normalization of pixel values helps to produce the comparable feature values without considering the large variations of pixel intensities between the sampling lines and the images.
3. Quantitative Measurement of Fracture-ness on a Rib
In chest radiographs, rib fractures appear as step-like contour deformities, radiolucent lines or overriding bone fragments [11]. To distinguish these abnormalities from the normal shape of ribs, we assume that an unfractured rib has bilateral symmetry to the centerline first. When a rib is broken, the pipe-like shape of the rib may not be maintained, and this change can be recognized by the discontinuity of the hard outer layer of the rib and more complicated texture on the rib. Under this assumption, fracture-ness, which indicates the magnitude of the regional changes of ribs, is quantified with measures representing the local shape and texture features of ribs.
Fracture-ness measurement is performed at each sampling line along the centerline of a rib. Figure 1B shows a diagram of fracture-ness measurement. Around a sampling line, the neighbor sampling lines in the range of a specific physical length, called a unit length, are averaged for the fracture-ness measurement. Through this approach, the average sampling line represents not only the local shape information of the ribs, but the continuous features, such as the hard outer layer of the ribs, are also emphasized as well. In addition, it is also expected to find a relationship between the physical size of broken regions of ribs and the unit length. With the averaged lines in the measurement area, three quantitative measures (asymmetry, contrast, and homogeneity) are computed to discriminate the abnormalities caused by rib fractures.
1) Asymmetry
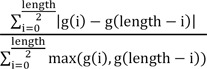
Asymmetry measures the bilateral similarity of a line on its center point [12]. Asymmetry is defined as Eq. (1). "Length" in Eq. (1) means the length of the sampling lines, and "g(i)" means the pixel value of the line at index i. Here, "max(x,y)" denotes the larger value between x and y. This measure generates larger values as the pixel intensities of both sides of the line are more different. If a line is completely symmetric on the center point, the asymmetry of the line is 0.
2) Gray-level co-occurrence matrix: contrast and homogeneity
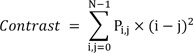
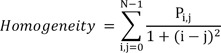
A gray-level co-occurrence matrix (GLCM) is a two-dimensional matrix whose size is the same as the number of gray levels in an image. Each element of the GLCM indicates how often a pair of pixels with a specific spatial relationship occurs in the image [13]. To build a GLCM, we count the occurrence of pixel pairs at a symmetric position with respect to the center point of each sampling line. If the pixel distributions on either side of the center point are similar, the GLCM is close to the diagonal matrix. The GLCM is normalized by dividing each element of the matrix by the sum of element values. In this study, we used two features based on GLCM, contrast and homogeneity, to quantify the local texture feature of ribs. We assume that the texture property of each sampling line is consistent along the centerline, if ribs are not broken. When a rib is not broken, the values of each feature do not change much along the centerline, and the values of contrast in unbroken regions of ribs are smaller than the values in broken regions. Homogeneity shows the opposite tendency of contrast. Eqs. (2) and (3) are the equations of contrast and homogeneity, respectively. Here, Pi,j is the value at the (i, j) position of the normalized GLCM, and N is the number of gray levels.
4. ROI Analysis: Fracture and Normal ROIs
To evaluate this measurement method, we applied an region of interest (ROI) analysis which classifies sub-regions of ribs into two groups, a fracture group and a normal group. The fracture group includes the rib segments containing the broken parts of ribs identified by a radiologist. Figure 2 shows examples of various morphologies of fractured and normal ribs. A total of 18 fracture ROIs and 30 normal ROIs were drawn and analyzed. The centerlines and the thickness values of ribs in each ROI were determined in the original images. The lengths of centerlines and the thickness values on the ROIs are described in Table 1. The thickness values of fracture ROIs are larger than normal ROIs to cover the abnormal shapes of broken ribs completely.
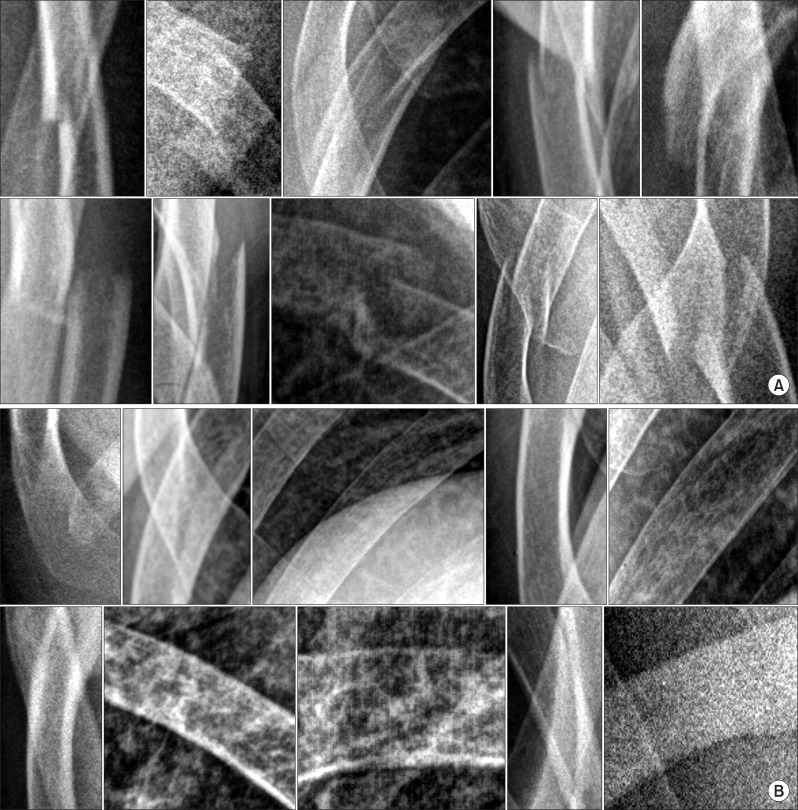
Various morphologic features of (A) fractured and (B) non-fractured (normal) ribs on which region of interests were drawn. The window-level of each image is adapted for print.

Descriptive values of the measurement area assignment for each ROI group
The measurement was performed with various unit lengths to look into the effect of unit length. For this purpose, the assigned rib areas of each ROI were sampled into 150 to 200 sampling lines to set the space between sampling lines below 0.05 mm. The measured values of asymmetry, contrast, and homogeneity for every sampling line were averaged to be used as the descriptive values of each ROI. The independent 2-tailed Student t-test was employed to find the statistically significant difference between the descriptive values of each ROI group. p-values less than 0.05 were considered statistically significant in this research.
5. Rib Fracture Classification using SVM
To verify the discriminating ability of our measurement method for abnormalities in the entire rib, rib fracture classifiers were constructed using SVM. SVM is a supervised learning method that generates a linear decision surface from the feature space where the input vectors are nonlinearly mapped [14]. The role of the rib fracture classifiers was to classify the sampling lines of ribs into the fracture group and the normal group. The rib fracture classifiers were implemented with the KSVM package [15] in R software (R 2.11.1, R Development Core Team). The rib fracture classifiers were trained with the measured values of fracture ROIs (18 cases) and normal ROIs (30 cases) used for ROI analysis (refer to fracture and normal ROI description in the previous section). The model parameters of SVM used to construct the rib fracture classifiers are listed in Table 2.
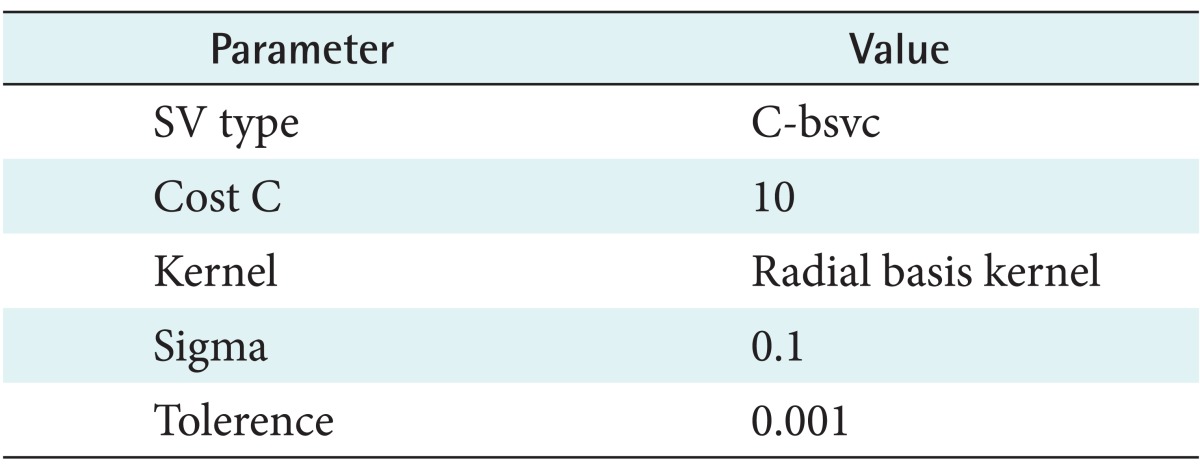
Model parameters of support vector machine used to construct the rib fracture classifiers
The classification results are represented as a "true positive (TP) line set" and a "false positive (FP) line set". A TP line is a sampling line that is classified into the fracture group from the broken parts of ribs. A FP line is a sampling line that is classified into the fracture group from the unbroken parts. The set of TP lines and FP lines provide the regional information of the classification results. The "FP line set" comprises non-broken rib segments including continuous FP lines. The "TP line set" comprises the broken rib segments including continuous TP lines. When abnormal sampling lines are detected continuously in specific regions, the presence of a rib fracture is generally expected more in those regions.
III. Results
Figure 3 shows the values measured with various unit lengths for fracture and normal ROIs. When the ratio of the unit length to the length of the centerline is below 0.1 (dotted vertical line in Figure 3), three measures of our measurement method, asymmetry, contrast, and homogeneity, generated a smaller range of values for fracture ROIs than of normal ROIs. The unit length range was from 0.1 to 1.0 mm, when the ratio of unit length was below 0.1. When the ratio was larger than 0.1, the variance of measured values in fracture ROIs increased. Based on this observation, we performed the measurement with a constant unit length of 0.5 mm to figure out the significant difference between the measured values in fracture ROIs and normal ROIs. We determined the constant unit length as the middle point of the range of unit length, which showed the distinguishable results between fracture ROIs and normal ROIs in the previous measurement. Figure 4 shows box-plots of the measured values with the unit length of 0.5 mm for each ROI group. Table 3 shows the descriptive values of three measures and the results of the independent 2-tailed Student t-test. A statistically significant difference was found between the results of fracture ROIs and normal ROIs with respect to asymmetry (p < 0.0001), contrast (p < 0.001), and homogeneity (p = 0.022).
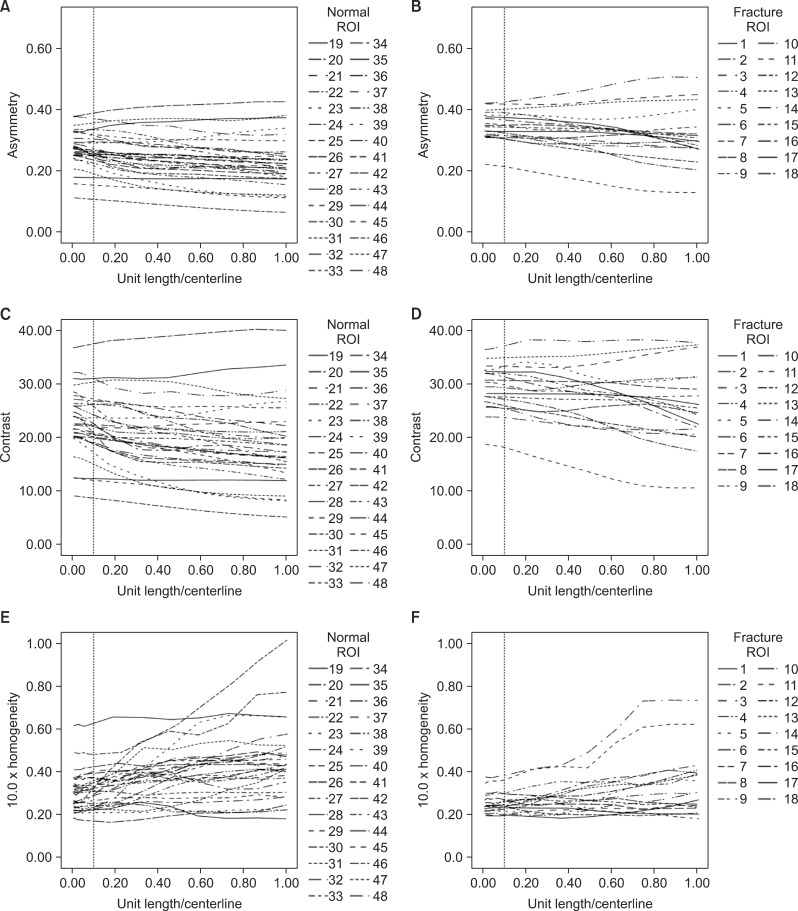
Measured values with various unit lengths for normal and fracture region of interests (ROIs). (A, B) Asymmetry, (C, D) Contrast , and (E, F) 10.0 × Homogeneity . "Centerline" means the length of the centerline for each ROI. The dotted vertical lines indicate 0.1 of the ratio, "Unit length/Centerline".
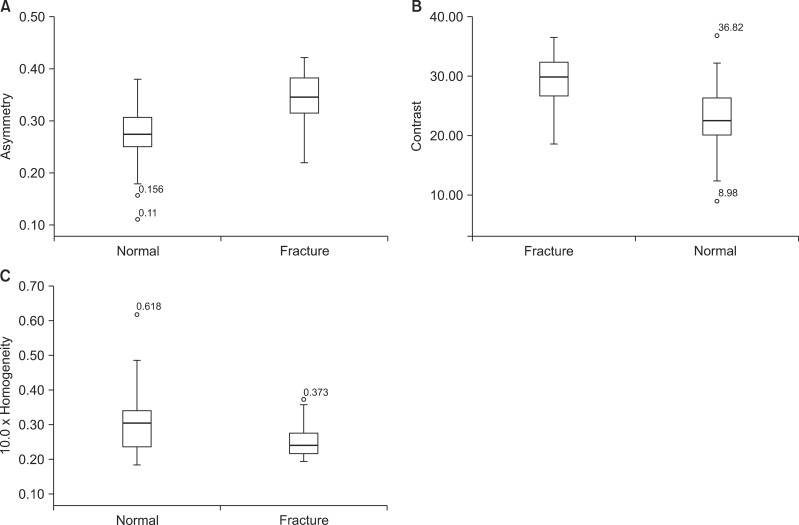
Box plots of measured values with a constant unit length (0.5 mm) for fracture region of interests (ROIs) and normal ROIs. (A) Asymmetry, (B) Contrast, and (C) 10.0 × Homogeneity.
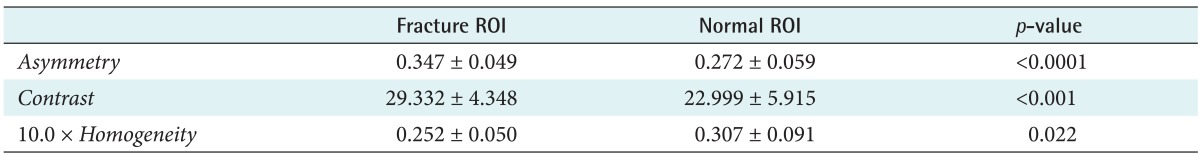
Descriptive values for fracture and normal ROIs
We applied our rib fracture classifier based on SVM to chest radiographs used for ROI analysis. The classification process was performed with the values of three measures which were computed along the ribs in chest radiographs. We defined the measurement areas of the ribs from the angle to their anterior extremity. The average centerline length for the rib areas was 131.067 ± 29.460 mm, and the average thickness was 9.778 ± 7.546 mm. The average space between sampling lines was 0.263 ± 0.588 mm. The unit length used for the measurement was 1.0 mm. The classification results are described in Table 4. With our rib fracture classifiers, every rib fracture was successfully detected as TP line sets in each image. However, some normal sampling lines were classified into the fracture group and 8 to 17 wrong segments (FP line sets) of 2.998 ± 2.652 mm (max, 15.21 mm; min, 0.95 mm) were detected per chest image on average.

Results of rib fracture classification using support vector machine
IV. Discussion
In chest radiographs, rib fractures are detected by abnormalities on the ribs, such as the discontinuity of cortical bone overriding bone fragments, and linear radiolucent lines within the fractured ribs. To discriminate the broken parts of ribs from chest radiographs, we proposed a method to measure these abnormalities. The measurement method comprises two steps: 1) a single rib area assignment and sampling step and 2) a fracture-ness measurement step. The single rib area assignment using a spline is suitable for reducing the measurement area from the whole chest image to a rib. This step is necessary to produce comparable values representing the shape of a rib locally. In this approach, the shape and texture of a rib are quantified in terms of asymmetry, contrast, and homogeneity. Our measurement method is applicable to chest radiographs of various views (e.g., PA or oblique view), because it measures fracture-ness using the local shape features, which are calculated along the centerline of each rib and normalized against the differences in the pixel values.
We evaluated our measurement method for possible rib fractures by ROI analysis. When the ratio of the unit length to the length of the centerline is below 0.1, each measure generates more meaningful values to discriminate each ROI group. This result indicates that a constant unit length can be used to measure the fracture-ness of ribs. The ROI analysis results showed that the changes of rib shape caused by rib fractures can be discriminated from the normal shape of the ribs using the proposed method. The asymmetry, contrast, and homogeneity measures showed good ability to discriminate between fracture and normal groups. These results suggest that the shape and texture features of ribs to the centerline are normalized and quantified properly by the proposed measures to adequately compare the shape and texture of ribs between different chest radiographs.
In addition to ROI analysis, we also performed rib fracture detection using a combination of our measurement method and SVM. All broken parts of ribs were detected as 1 to 3 segments by the rib fracture classifiers (zero false negative). We deem these results as sufficient to suggest the location of suspected rib fracture regions to clinicians without missing the actual broken parts of the ribs. However, the classifiers also produced many FP line sets as the small segments (2.998 ± 2.652 mm) on ribs. Figure 5 shows examples of rib fracture classification. Although the results were also influenced by the training data, the model parameters, and the sampling rate of rib areas, they also imply that some parts of unbroken ribs have similar features to the broken parts. The FP line sets were observed in regions with following conditions: 1) uncertain rib boundaries and severe noise, 2) overlap with other organs, such as the liver and heart, and 3) overlap with other ribs or itself. Therefore, the sensitivity of our rib fracture classifier can be improved by characterizing the overlap regions between the ribs and other organs.
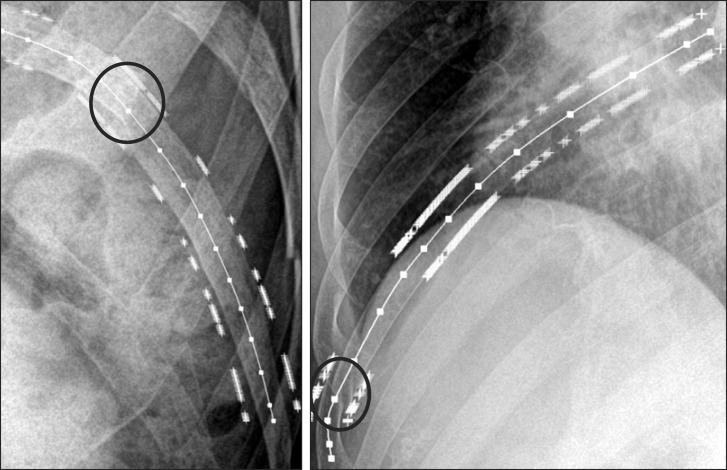
Examples of rib fracture detection results. The training data of the rib fracture classifier were the asymmetry values of our measurement method. The dots indicate the end points of the sampling lines which are classified into fracture group by the rib fracture classifier. The black circles indicate the actual broken part of ribs. The lines with square dots are the centerlines of the ribs.
This approach can be extended to an automatic or semi-automatic method by adopting rib boundary extraction techniques. The centerlines and thickness values of each rib can be easily determined by sampling the extracted boundaries and defining the control points between the closest points of the boundaries on each side. However, because these methods usually assume that the boundaries of ribs are fully connected or the ribs are not broken, some of these methods need to be modified to extract the ribs of abnormal shape due to rib fractures.
The development of computer-based automatic detection of rib fractures in chest radiographs is difficult at present because chest radiographs have their own defects, such as image noise in showing bony detail. In addition, the miss rate of rib fracture detection by radiologists can be over 30% if there are multiple abnormalities in chest radiographs [6]. Accordingly, to improve the accuracy of rib fracture diagnosis, it is recommended that the suspicious regions, where rib fractures can be found with the higher possibility, are suggested to clinicians. Furthermore, the analysis of regions where rib fractures are easily missed should be performed in clinicians' view to archive this requirement and extend this work in future studies. To achieve satisfying results in the detection of smaller fractures and various types of fractures as well, larger patient populations with a reliable annotation of lesions of this kind are required for the evaluation of detectors.
In this paper, we demonstrated that adequate comparable values to discriminate the broken parts of ribs in chest radiographs can be obtained by the proposed method. With this method, it may be possible to build a computer-aided method which can identify suspected regions of rib fractures to assist clinicians.
Acknowledgments
This research was supported by the Basic Science Research Program through the National Research Foundation (NRF) of Korea funded by the Ministry of Education, Science and Technology (2012R1A1A2007991, No. 2011-0009761).
Notes
No potential conflict of interest relevant to this article was reported.