

I. Introduction
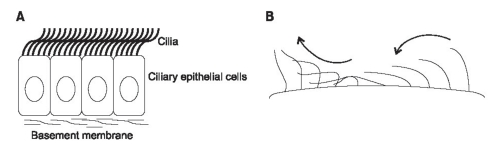
The main task of the mucociliary transport system in ciliary airway epithelia is removal of inhaled foreign materials, intrinsic irritants, cellular debris, and particles by propulsion of mucus, a major defense mechanism of the respiratory tract [1]. Dysfunction of ciliary beating can lead to impairment of mucociliary transport, an inherent pathological characteristic of patients with primary ciliary dyskinesia, asthma, and bronchiectasis [2]. Metachronal coordination of cilia causes their propulsive efforts in creation of a continuous movement of mucus. The overall propulsive effort of ciliary beating is dependent upon the length of the cilia, arrangement, metachronal relation, and ciliary beat frequency (CBF) [3]. CBF is increased by increases in tip velocity and metachronal activity [4], as a result of a main parameter controlling mucus clearance needed for regulation of CBF (Figure 1).
A number of methods have been developed for measurement of CBF; however, the majority of methods suffer from major limitations. One of the earliest methods uses synchronization of a stroboscope; however, it is inaccurate at frequencies lower than 10 Hz. High-speed cinematography is regarded as the most accurate method for measurement of ciliary beating frequency [5,6]. An observer plays a recorded ciliary image at a slow speed and determines the CBF. Various other techniques have been developed for resolution of the handicaps of high-speed cinematography, including time-consuming, high price, and observer fatigue. Widely utilized methods among these techniques include photomultiplier [7] and photodiode [8] techniques using a photo-electric signal. These methods indirectly estimate beat frequency by detection of changes in light intensity passing through ciliary beating. These methods do not make direct use of microscopic images; instead they use reflected or transmitted light for measurement of CBF. In this way, the measured CBF could also include other external variations. More recently, automated methods using a digital video-image which allows for advanced image processing of ciliary beating [9]. This method analyzed digitized regions of interest (ROI) from a microscope or recorded image. This method offers several advantages, including ease of use, relatively low cost of equipment, and highly compatible digital recording media. Many digital video-image methods utilize image processing based on difference image for calculation of CBF [9,10]. However, measurement of difference image with overlapping objects or slow down performance according to shape of object is difficult. This study proposed a new method based on optical flow for image processing and peak detection for signal processing. We compared the measurement accuracy of the method using a combination of image processing (optical flow versus difference image) and signal processing (fast Fourier transform [FFT] vs. peak detection).
II. Methods
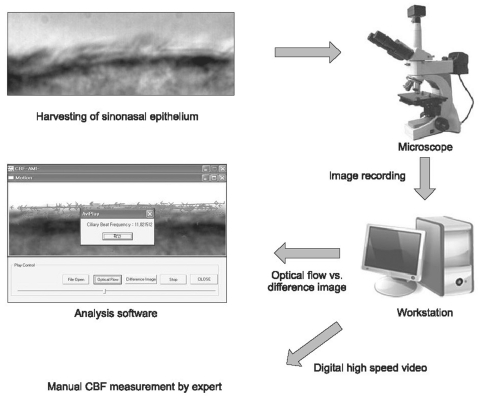
CBF of ciliary epithelium images was measured by each of four combined image processing and signal processing techniques. The measured CBFs were compared with manually measured CBF using a digital high-speed video (HSV) method (Figure 2).
1. Subjects
Ciliated sinonasal epithelium was harvested during surgery from patients who had not received antibiotics during a period of three months and had an asthma or allergic reaction. The harvested sinonasal epithelium was stabilized by incubation in transfer medium (DMEM/F12: Dulbecco's Modified Eagle's Medium/Ham's F-12, Gibco BRL, Grand Island, NY, USA), which was added to 1% 10,000 units/mL penicillin and 10,000 ug/mL stertomycin. Harvested sinonasal epithelium was washed using transfer medium for removal of substances like blood wash and was then placed in 0.1% protease (Sigma, St. Louis, MO, USA) into transfer media. It was placed in a 5% CO2 incubator at 37Ōäā for 1 hour.
We obtained the recorded 50 ciliated sinonasal epithelium image from the department of Otolaryngology. Ciliated sinonasal epithelium images were recorded at 50-100 frames per second using a charge coupled device camera (Moticam 2000, Motic Inc., Hong Kong, China) from an inverted microscope (Axiovert 200 MAT, Carl Zeiss, Hamburg, Germany) at a magnification of ├Ś1,000, and stored in a workstation.
The application was developed for use with Microsoft Visual C++ 2005 (Microsoft, Redmond, WA, USA). The developed application allowed for automatic measurement of CBF from a stored image, and compared optical flow and differences in imaging techniques.
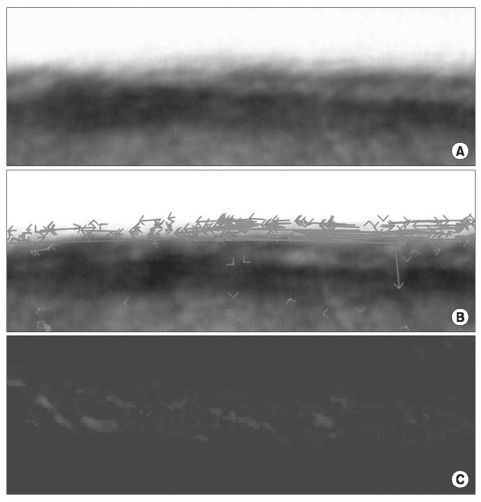
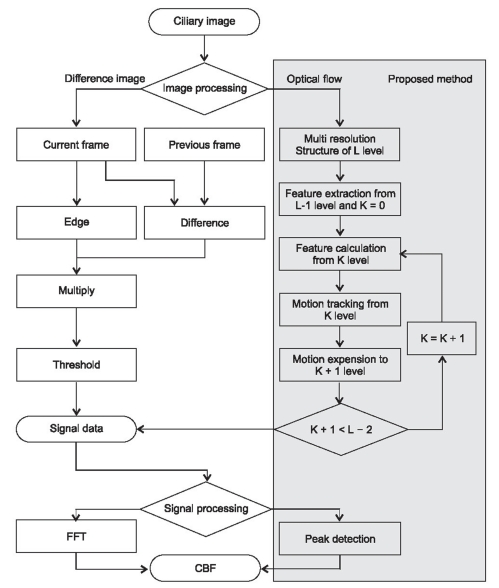
This application involves two stages, which include extraction of features and analysis of extracted features. On feature extraction stage, we adopted two types of preprocessing methods, including image difference and optical flow method (Figure 3). For analysis of the extracted feature in the previous step, we adopted two methods; FFT and simple peak detection (Figure 4).
2. Image Processing
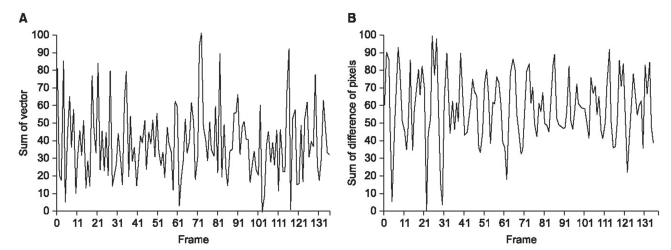
This study applied difference image and optical flow for extraction of features of ciliary motion (Figure 5). Ciliary motion shows periodic change of pixel brightness in images. This is related to ciliary beating frequency. Frame K is subtracted from frame K-1 at m ├Ś n pixels, and a regular signal by periods is obtained. Difference image method calculated difference of pixel in the previous frame versus pixel in the current frame for all pixels of each block, which were then added for calculation of difference of all pixels. Equation (1) extracts signal from image.
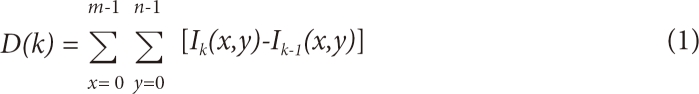
Where, I(x, y) refers to grey level of the pixel of frame K; D(K) is sum of grey level difference of frame K; m, n are image size (pixel).
Optical flow is one of the most general studies of motion recovery approaches. This term was introduced by Horn and Shunch [11]. They defined optical flow as motion of the imaging surface at changing brightness of 2-D images according to real motion of an object in the 3-D space [11]. Optical flow field estimated the spatio-temporal pattern of image or signal intensity using an optical flow algorithm. Let I (x, y, t) be the image brightness at a location (x, y) and time t, which changes in time in order to provide an image sequence. Two main assumptions can be made. First, brightness of every point of a moving or static object does not change in time. If the object is moving, investigating the brightness around the object, it can search the moved point of the object according to the first assumption. Second, brightness, I(x, y, t), is dependent on coordinates (x, y) in the greater part of the image, called smoothness of velocity. According to two assumptions, function of time and location using continuous change of brightness makes motion modeling. Also, if K ├Ś K points around the object move together at object movement, least square search for the moved point (K is usually 5 or 10 pixels).
Local accuracy and robustness are the most important components of any feature tracker. Robustness is connected with sensitivity of tracking with reference to changes of lighting, size of image motion, etc. Accuracy is connected with the local sub-pixel accuracy attached to tracking. In order to handle large motions, it is preferable to select a large integration window. When choosing the integration window size, there is interchange between local accuracy and robustness. Therefore, we adopt a pyramidal implementation of the Lucas-Kanade algorithm in order to provide a solution to this problem [12]. The pyramid representation is built in a recursive fashion.
Let L = 1, 2, ... be a generic pyramidal level, and the value of Lm is the height of the pyramid. The following is the pyramidal implementation of the Lucas-Kanade algorithm.
1) Compute the optical flow at the deepest pyramid level Lm.
2) Propagate the result of the computation to the upper level Lm in a form of initial estimates for pixel displacement at level Lm-1.
3) Compute the refined optical flow at level Lm-1.
4) Propagate the result of the computation to the level Lm-2.
5) And so on up to the level 0 (the original image).
This algorithm shows substantially better performance than traditional gradient methods, since it allows for tracking of large feature movements through the image sequence.
3. Signal Processing
This study used peak detection and FFT techniques for calculation of CBF using optical flow and difference image methods. Both FFT and the peak detection algorithm are the most widely used algorithms for computation of the frequency of signals. The FFT is a much faster algorithm for computation of the discrete Fourier transform (DFT), because it utilizes symmetry in order to reduce operators. The FFT is used in a wide variety of applications, from signal processing to solve partial differential equations to an algorithm for quick multiplication of large integers. The applied high pass filter to FFT analyzes the signal for extraction from the image using AutoSignal 1.7 (SeaSlove, San Jose, CA, USA). As a result of the FFT power spectrum, the frequency representing the highest amplitude was used as the CBF. The calculation of CBF was (analyzed frame number ├Ś frequency ├Ś 2) / recorded image time.
Any continuous periodic waveform presents a variety of useful information, including the beginning and end points of a cycle, the minimum, maximum, or mean signal values within the cycle, and the rate at the repetitive cycle. In many cases, this information is obtained from a quick glance at the waveform and simple calculation. In this paper, we found that one peak height is one ciliary beating cycle. Therefore, the peak detection method is simpler than the FFT. The peak detection method finds a peak of signals over average values with weight calculated by the percentage of the average.
4. Digital High Speed Video
The gold-standard used in this study was the digital high-speed video method, for which CBF is measured manually by an expert observing the video in slow play. This study recruited in a field of at least 2 years. Videos were presented to the observer in a random order with no information given regarding the CBF. Ciliary beating was observed frame by frame. The observer pressed the button of the application, which moves one frame, and measured ciliary beating from the obtained image. The observer measured until 10 cycles, and noted the starting time and ending time of the image sequence. CBF was calculated using equation 2.

III. Results
This study compared the accuracy of the method using a combination of image processing based on optical flow versus difference image and signal processing based on FFT versus peak detection. We evaluated the four methods using a combination of the four algorithms.
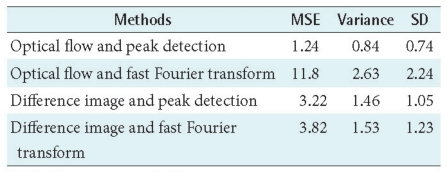
This study compared the four methods with the most accurate digital high speed video for measurement of the accuracy of each technique using fifty ciliary images. Table 1 shows a comparison with the CBF mean square error (MSE) and the variance of the four methods. The combination of optical flow and peak detection in the proposed method appeared to be the lowest MSE (1.24 Hz) and variance (0.84 Hz). In cases of combination of difference image, neither peak detection nor FFT showed a large difference of MSE. However, in the case of combination of optical flow, two techniques of signal processing showed a large difference of MSE.
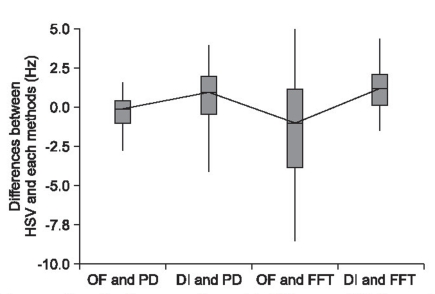
Figure 6 shows the box plot for comparison of CBF difference between HSV and four methods. In each box, the central mark appears as the median; the band near the middle of the box includes the 50th percentile, and the bottom and top of the box are the 25th and 75th percentile, and outliers are plotted individually. In this study, the box plot showed two outliers in the combination of difference image and FFT. The box plot showed that the length of the combination of optical flow and peak detection was shorter than the length of box in other methods.
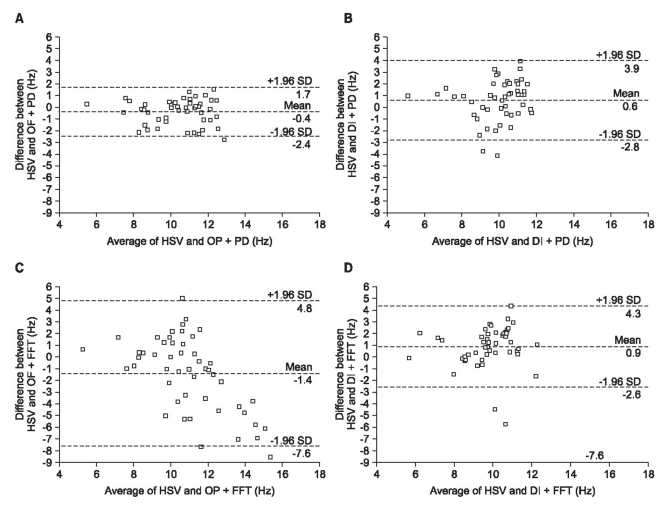
The Bland-Altman limits of agreement with respect to the digital high speed video method showed closest agreement for the combination of optical flow and peak detection method (-2.44 to 1.74 Hz) among the combination of difference image and peak detection (-2.79 to 3.94 Hz), optical flow and FFT (-7.61 to 4.77 Hz), and difference and FFT (-2.56 to 4.33 Hz) method (Figure 7).
The difference image combined with peak detection and FFT showed a similar variation of maximum and minimum value in the difference of HSV and each method. However, the optical flow combined with the two methods of signal processing appeared to be a large variation of the difference (Table 2).
IV. Discussion
Ciliary beating of airway epithelia plays a key role in the mucociliary transport system. Functional disorder of ciliary beating leads to recurrent airway infection. Although it has been quantified in the past using various methods, with advancement of techniques, the accuracy and comfortability of CBF measurements continue to evolve. CBF values change depending on the measurement method. Findings from a previous study appeared to demonstrate that CBF shows significant difference according to digital high speed video, photomultiplier, and photodiode techniques [13]. In this study, we performed objective measurements of CBF and compared the result with digital high-speed video, since it is known to be the most accurate. The minimum sampling rate for CBF measurement must meet with the Nyquist criterion, which postulates that the sampling interval has to be equal to or less than one-half the period of the frame rate being recorded. Conventional video image capture methods are limited, because of a slow sampling rate at 30 fps, thus restricting accurate CBF measurements to frequencies of <15 Hz. We used a >50 fps recorded image in order to overcome the confronting limitations. This frequency rate expands most CBFs measured in higher reference animals. This study did not consider optimization of spatial resolution; however, optimization of spatial resolution may show decreased complexity and improved performance of methods for CBF measurement. The most commonly used method for estimation of CBF using image analysis is the combination of image processing based on difference image, and signal processing based on FFT [14,15].
Difference image is not easy to track ciliary motion because it is difficult to measure with overlapping object. However, optical flow has the advantage of tracking of overlapping objects. For this reason, this study used optical flow for measurement of CBF. As for the image used in this study, the proposed method, the combination of optical flow and peak detection (MSE and variation were 1.24 and 0.84 Hz, respectively), showed the MSE and variation better than the commonly used method (the MSE and variation are 3.82 and 1.53 Hz). This study showed the box plot for graphic depiction of groups of methods through their five-number summaries: the smallest observation, lower quartile, median, upper quartile, and largest observation. The combination of optical flow and peak detection showed the shortest length of the box. Optical flow has a higher computational complexity than difference image. In this study, the high computational complexity of optical flow has no limitation, due to improved performance of computers. According to the result of this study, combination of optical flow and peak detection is recommended for measurement of CBF.
Earlier studies for comparison of the digital high speed video method with the commonly used photomultiplier (-2.30 to 6.06 Hz) and photodiode methods (-2.75 to 5.15 Hz) used the Bland-Altman plot to show the difference among the three methods [13]. In this study, the Bland-Altman limits agreement appeared to be the closest agreement for the proposed method (-2.44 to 1.74 Hz). In the case of photomultiplier and photodiode, use of an expensive device for measurement of CBF is necessary, while the proposed method shows high potential for use with a standard device (microscope equipped with cameras and PC). It can measure CBF at a small cost when you have a standard device. However, limitation of the proposed method is that it cannot measure CBF in vivo.
In this study, we measured CBF using the newly developed image processing system and compared other methods. The proposed method would appear to be a powerful tool for measurement of CBF of actively beating cilia.