User Experience of Augmented Reality Glasses-based Tele-Exercise in Elderly Women
Article information

Abstract
Objectives
The purpose of this study was to identify any difference in user experience between tablet- and augmented reality (AR) glasses-based tele-exercise programs in elderly women.
Methods
Participants in the AR group (n = 14) connected Nreal glasses with smartphones to display a pre-recorded exercise program, while each member of the tablet group (n = 13) participated in the same exercise program using an all-in-one personal computer. The program included sitting or standing on a chair, bare-handed calisthenics, and muscle strengthening using an elastic band. The exercise movements were presented first for the upper and then the lower extremities, and the total exercise time was 40 minutes (5 minutes of warm-up exercises, 30 minutes of main exercises, and 5 minutes of cool-down exercises). To evaluate the user experience, a questionnaire consisting of a 7-point Likert scale was used as a measurement tool. In addition, the Wilcoxon rank-sum test was used to assess differences between the two groups.
Results
Of the six user experience scales, attractiveness (p = 0.114), stimulation (p = 0.534), and novelty (p = 0.916) did not differ significantly between the groups. However, efficiency (p = 0.006), perspicuity (p = 0.008), and dependability (p = 0.049) did vary significantly between groups.
Conclusions
When developing an AR glasses-based exercise program for the elderly, the efficiency, clarity, and stability of the program must be considered to meet the participants’ needs.
I. Introduction
Augmented reality (AR) technology is undergoing rapid development and application, particularly in fields such as surgery and medical education [1]. AR refers to the real-time interaction between real space, virtual data space, and objects, with actual and digital information combined within the user’s field of vision; as such, the technology can present digital information that is difficult for users to detect or utilize in the real world [2].
Exercise video content has become accessible and affordable through YouTube, smartphone applications, and other platforms. Consequently, increasing numbers of people watch and follow exercise content in their living spaces. In addition, the use of wearable health-monitoring devices in conjunction with smartphones has promoted a steady increase in the number of people utilizing self-exercise management services based on mobile apps or internet websites [3,4]. As interest in AR-based exercise increases, studies have demonstrated associated improvements in muscle strength, joint mobility, exercise speed, and control [5]. The safe application of AR technology in elderly individuals can be facilitated by considering ways of improving AR technology to reduce content-related inconvenience; changing the user’s head rotation, viewing angle, and head rotation speed; and understanding correlations between camera movement and user discomfort with regard to content, screen elements, and vertical synchronization [6,7].
For elderly individuals, exercise is necessary to improve physical fitness and prevent disease [8]. Traditionally, elderly people exercise primarily through group and face-to-face interactions, at locations such as senior centers or cultural centers. However, since the coronavirus disease 2019 (COVID-19) pandemic began, various non-face-to-face methods based on information and communications technology have been introduced for exercising within living spaces [9,10]. In addition, remote exercise programs based on tablet videoconferencing have been associated with improvements in bone flexibility and muscle mass, as well as reductions in muscle atrophy and fall risk factors in elderly women [11]. Interest in AR-based exercise interventions has also increased, and studies have revealed positive effects on patients with stroke and Parkinson disease [12,13].
User experience (UX) encompasses the psychological and emotional responses of users based on their experiences using a product. UX reflects various aspects of human reactions, such as the visual and auditory senses as well as responses to external stimuli when using the product [14,15]. International Organization for Standardization (ISO) 9241-210, an international standard for human-computer interaction within human-system ergonomics, defines UX as “a person’s perceptions and responses that result from the use or anticipated use of a product, system, or service.” Under the ISO definition, UX includes all emotions, beliefs, preferences, perceptions, physical and psychological responses, behaviors, and achievements of users that occur before, during, and after product use. Thus, UX refers to the holistic physical, emotional, mental, and psychological experience of users during the entire process of using a product or service [16].
In today’s rapidly changing digital environment, older adults can struggle to learn to use digital devices and often lack experience in using them unaided. Relatedly, insufficient research has been conducted on UX among the older population. Hence, to utilize information technology among older adults, we must reflect on the feelings of these individuals regarding system use. By examining UX among older adults, we can understand their interest in using a certain service and consequently develop elderly-friendly services. This can help increase older adults’ user satisfaction by reducing the discomfort associated with usage. Moreover, elder-friendly services can serve as a driving force for these adults to enjoy exercise for long periods using information technology. Therefore, this study was conducted to investigate the UX among older adults using AR glasses in remote exercise programs. We suggest a direction for development of an AR glasses-based exercise program optimized for the requirements and technical skills of older users.
II. Methods
1. Participants
This study included 27 elderly women (76.40 ± 4.02 years old) residing in Incheon, Republic of Korea who reported having no exercise experience in the prior month and who consented to participate. Both the tablet group (13 participants) and the AR glasses group (14 participants) included individuals who had no issues with the Physical Activity Readiness Questionnaire and who could perform the exercises. Participants with cognitive impairment, as indicated by a score of 21 or lower on the Korean version of the Mini-Mental State Examination, were excluded. Additionally, participants with orthopedic problems, those with hearing or visual impairments, and those unable to communicate or follow instructions were excluded. This study was approved by the Institutional Review Board of Seoul National University Hospital (No. C-2012-139-1183).
2. Procedure
Before the study began, an assistant researcher visited the residential spaces of the participants and provided them with tablets, AR glasses (Nreal; Matrix Reality Technology Co. Ltd., Beijing, China), chairs, mats, and elastic bands. The participants were given instructions on how to use the tablet and how to connect it and the AR glasses to a smartphone (LG V50S ThinQ; LG, Seoul, Korea). They were also taught to operate the AR equipment. While watching a pre-recorded video on their tablets and glasses, the participants followed along with exercises demonstrated by an exercise instructor. The instructor could observe exercise movements through the camera built into each participant’s tablet and provide real-time feedback. In addition, the assistant researcher remained in the same space as the participants to ensure participants’ safety during exercise. A usability evaluation questionnaire was completed by participants in a 1:1 ratio with a research assistant after the exercise program.
3. Tele-Exercise Program
In this study, the operating system developed by Hong et al. [11] for a WebRTC server was used (Figure 1). Both the exercise instructor and the participants accessed the server through WebRTC and followed the same exercise program. The program was based on the exercise program recommended for elderly adults by the American College of Sports Medicine and consisted of muscle strengthening exercises that included sitting or standing on a chair [17], bare-handed calisthenics, and muscle strengthening using an elastic band (TheraBand; The Hygenic Corp., Akron, OH, USA). The exercise movements were presented first for the upper and then the lower extremities, and the total exercise time was 40 minutes (5 minutes of warm-up exercise, 30 minutes of main exercise, and 5 minutes of cool-down exercise). The exercise intensity was set at 14–15 on the Borg Rating of perceived exertion scale [18]. The instructor was an experienced exercise physiologist who provided real-time feedback to both groups.
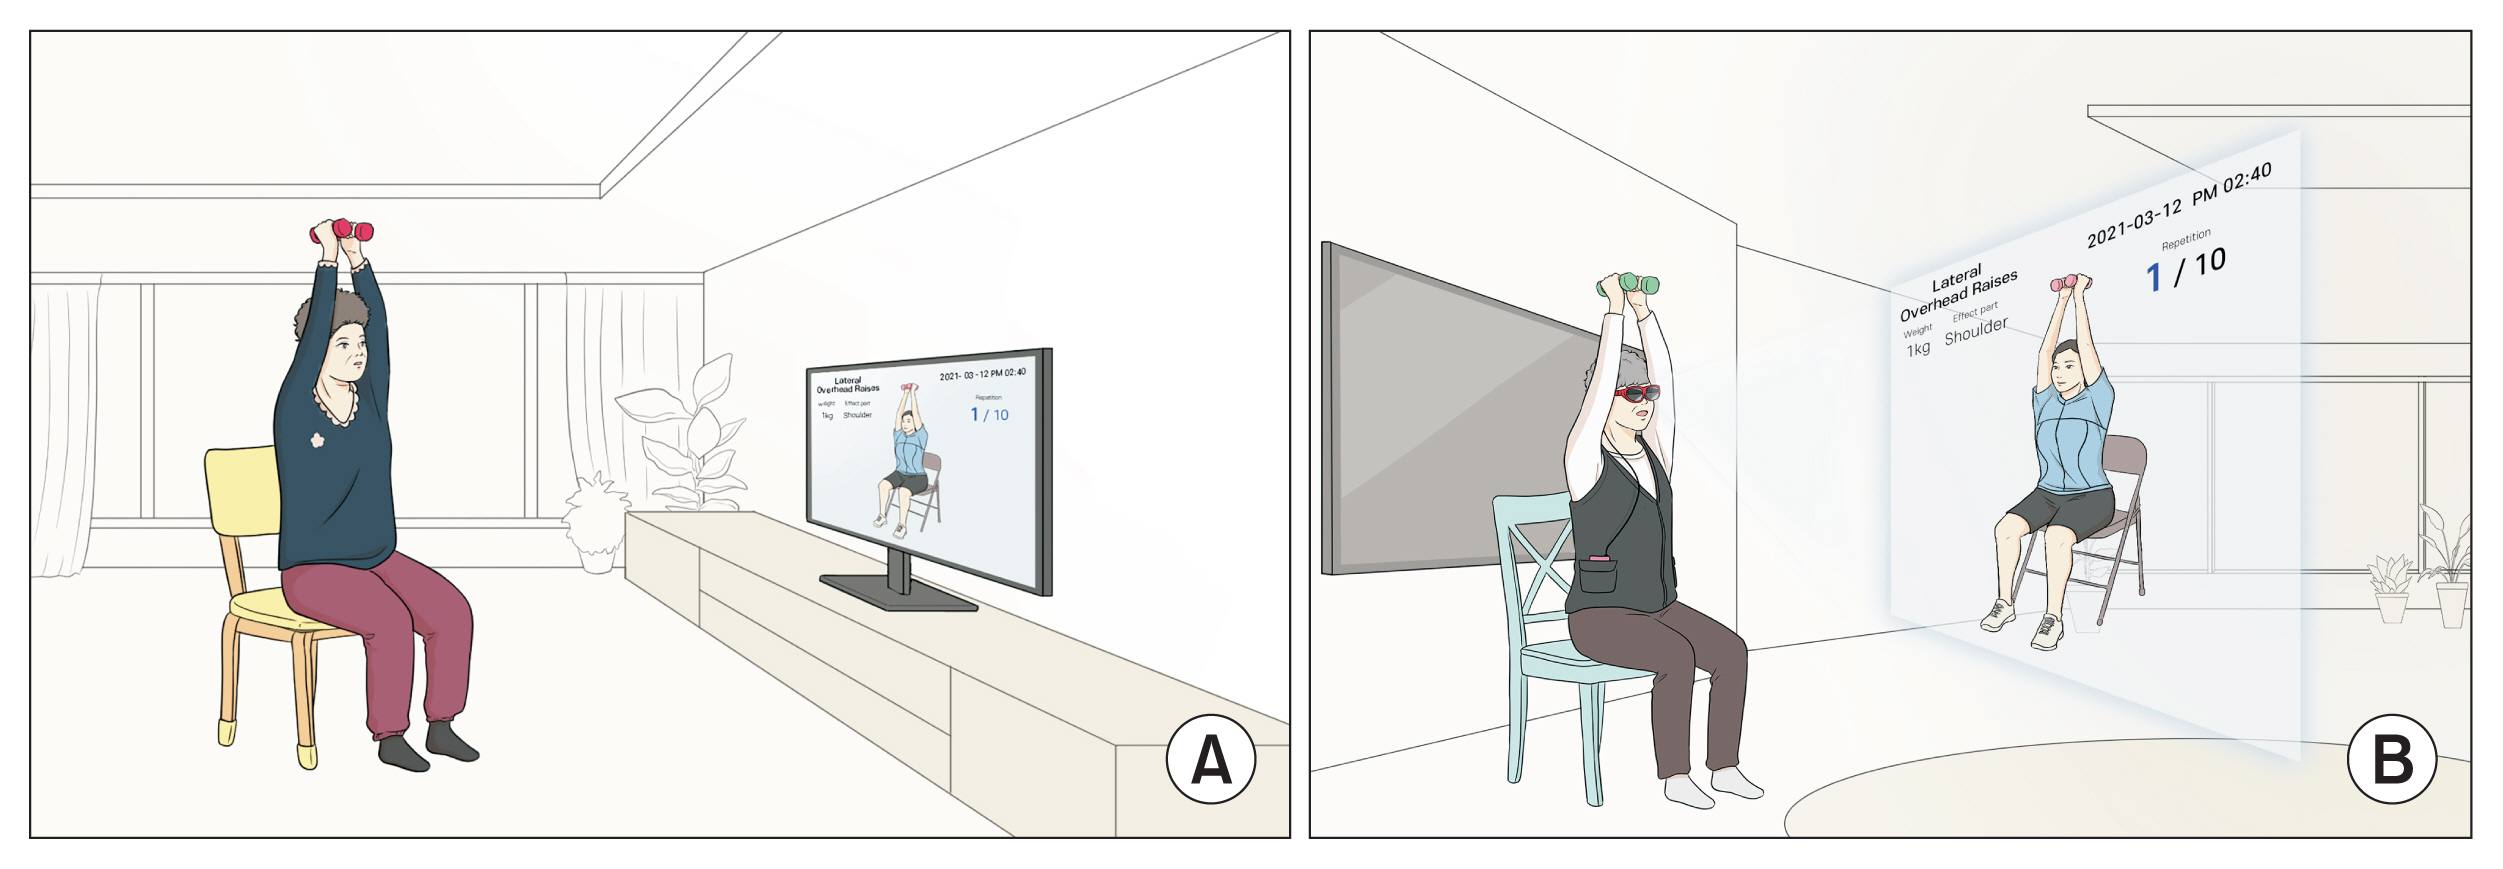
(A) Tablet personal computer-based exercise and (B) augmented reality glasses-based exercise.
4. Measuring Tool
The measurement tool used in this study was the User Experience Questionnaire (UEQ) [19], which includes six scales: attractiveness, efficiency, perspicuity, dependability, stimulation, and novelty. It comprises 26 survey questions rated on a 7-point Likert scale [20]. The attractiveness scale consisted of six items relating to the product’s attractiveness, enjoyability, friendliness, and good feelings elicited from the participants. The efficiency scale included four items concerned with how fast, scientific, and practical the product was. Perspicuity was measured by four items regarding whether the product was easy to understand, clear, simple, and easy to learn. Dependability was measured by four items, related to predictability, safety, and whether the product met expectations. The stimulation scale consisted of four items concerned with whether the product was interesting and motivated use. The novelty scale included four items asking whether the product was innovative and creatively designed.
5. Statistical Analyses
Validity and reliability tests were conducted for the six scales of the UEQ measurement tool. A factor analysis was performed to ensure validity, and the Cronbach α was calculated to verify reliability. In addition, data were analyzed using the Wilcoxon rank-sum test to compare the measurement items between the tablet and AR glasses groups. The UEQ scores were converted to a scale of 0 to 100 using the formula:
All statistical analyses were performed using SAS 9.4 (SAS Institute Inc., Cary, NC, USA).
III. Results
1. Feasibility
To ensure the validity of the six scales of the UEQ measurement tool, the characteristics of each were derived after factor analysis using varimax rotation. In this method, based on the factor analysis, the questionnaire items corresponding to each of the six scales were classified into factors. Attractiveness was assessed using three factors among the six items: item #16 (pleasant), #24 (attractive), and #25 (friendly). Efficiency was assessed using two of its four items: #20 (efficient) and #22 (practical). Perspicuity was assessed using two of its four items: #2 (understandable) and #21 (clear). Dependability and stimulation were found to have a single factor including all four questions. Finally, among the four questions for novelty, item #3 (creative) and #15 (advanced) were selected (Table 1).

Validity analysis of the User Experience Questionnaire (UEQ)
2. Reliability
The reliability of the six scales was high (0.690–0.882). The reliability results for the UEQ are attractiveness, 0.882; efficiency, 0.690; perspicuity, 0.741; dependability, 0.760; stimulation, 0.823; and novelty, 0.819 (Table 2).
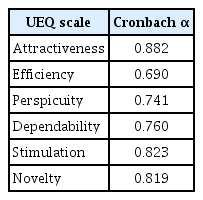
Reliability of measurement questions
3. Comparison between Groups
Of the six UX scales, attractiveness (p = 0.114), stimulation (p = 0.534), and novelty (p = 0.916) did not differ significantly between the groups. However, efficiency (p = 0.006), perspicuity (p = 0.008), and dependability (p = 0.049) differed significantly between the groups (Table 3).
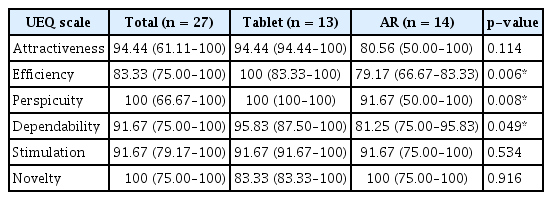
Differences in user experience scores between groups
IV. Discussion
The purpose of this study was to identify any difference in UX between tablet- and AR glasses-based tele-exercise programs administered to elderly participants.
Among the six UEQ scales, no significant differences were found between groups in attractiveness, stimulation, and novelty; however, significant differences were observed in efficiency, perspicuity, and dependability.
Attractiveness refers to the ease of understanding the functionality and operation of a product. Personal tastes and preferences influence the attractiveness of a product’s design, color, layout, and graphics [15]. In this study, no significant differences were observed in attractiveness between the two groups. Both groups showed relatively high scores, indicating a friendly and positive impression on elderly individuals accustomed to monitor-type screens, such as tablets or smartphones [20].
Stimulation refers to interest in using a product or service. This is related to user satisfaction with the product and is influenced by user motivation and interest [15]. Researchers can assess whether the visual and auditory feedback and interactions provided by a product affect the level of personalization. In this study, no significant difference was found between groups in the stimulation items, and both groups had relatively high scores. In addition, the elderly participants did not perceive either method of presenting visual stimuli (the tablet and the AR glasses) as boring or predictable. Both methods appear to motivate exercise.
Novelty is the degree to which a product or system can stimulate user interest due to its uniqueness and originality [19]. It can include both visual and functional aspects of a product, such as design, functionality, and the user interface. In this study, no significant difference was observed between the two groups in novelty, and both groups had relatively high scores. For both methods in this study, participants reported feeling novelty and creativity due to receiving real-time feedback on their movements, even though the exercise instructor was not actually in front of them. Although statistically insignificant, the novelty score was slightly higher in the AR group than in the tablet group. The large screen and wide field of view shown in the AR glasses allowed greater focus on the exercise image, even as it moved up, down, left, and right during the exercise. Thus, visual enhancement contributed to the interest of the elderly participants.
Efficiency refers to the practicality and efficiency of a product’s interaction with a system, thus indicating the ease with which a task can be completed using a product or service [15]. In this study, the tablet group displayed high efficiency, suggesting that familiarity with operating a smartphone or television screen influenced the speed of operation of the tablet system. Moreover, when the elderly participants wearing AR glasses exercised, the wires, earphones, and vests worn when connected to the smartphone felt uncomfortable and impractical. Therefore, these aspects require improvement when interventions using AR glasses are applied to the elderly.
Perspicuity indicates whether a user can clearly understand a product or system. This includes aspects such as the clarity of instructions, ease of navigation, and simplicity throughout the design [19]. The results were superior in the tablet group, indicating that the operation was clearly understood and could be performed easily when the elderly individuals used the tablet product. In this study, in the AR group, the process of connecting the glasses to a smartphone and accessing the smartphone program to play the video was more difficult than in the tablet group, confusing the elderly participants and resulting in a lower score in this category. Therefore, when applying interventions using AR glasses to elderly people, the system should be simple and easy to learn.
Dependability refers to whether products and services meet expectations and/or are stable. The more stable a product, the greater the likelihood of repeat use [19]. The results differed significantly between the groups and were higher in the tablet group; as mentioned above, various auxiliary equipment (earphones, earphones, wires, etc.) are thought to have interfered with the exercise. We believe that these issues contributed to system instability, and thus, the system failed to meet the expectations of the elderly individuals using AR glasses for the first time. Exercise is essential for elderly people, but as they age, factors such as rapid declines in physical ability, sensory function, and cognitive function hinder continued participation in exercise. In this regard, an exercise program based on AR glasses is a tool that could motivate elderly adults to continue exercising. AR-based exercise can increase interest and visual diversity, providing ongoing motivation. In addition, the software in AR glasses enables the recording, monitoring, and personalized coaching of daily exercise habits and movements, reducing the risk of injury and providing a safe exercise environment.
In the future, AR-based exercise programs should be researched not only for the elderly but also for other sex- and age-based demographics.
The limitations of this study are as follows. First, the sample size was too small to generalize the results. In particular, a nonparametric test was performed because of the small sample size. However, this is less reliable than parametric testing, and future studies will require larger numbers of participants. Second, we investigated the UX by conducting a one-time exercise program using AR glasses and a tablet; however, more reliable results may be obtained in the future if the UX is investigated over a longer period of use.
In conclusion, when developing an AR glasses-based exercise program for the elderly, the efficiency, clarity, and stability of the program must be considered to meet the needs of the participants.
Notes
Conflict of Interest
Hyoun-Joong Kong is an editorial member of Healthcare Informatics Research; however, he did not involve in the peer reviewer selection, evaluation, and decision process of this article. Otherwise, no potential conflict of interest relevant to this article was reported.
Acknowledgments
This study was supported by the Ministry of Education of the Republic of Korea and the National Research Foundation of Korea (No. NRF-2020S1A5B5A01043804) and the Institute of Information & communications Technology Planning & Evaluation (IITP) grant funded by the Korea government (MSIT) (No. 2021-0-00312, Development of non-face-to face patient infection activity prediction and protection management SW technology in home and community treatment center for effective response to infectious disease).