


I. Introduction
Since December 2019, the coronavirus disease 2019 (COVID-19) epidemic has incurred a significant health and economic burden worldwide. Even before severe acute respiratory syndrome coronavirus 2 (SARS-CoV-2) was identified as its causal agent, COVID-19-related information was already spreading uninhibitedly over traditional and social media platforms at a strikingly rapid pace [1]. This phenomenon, called an “infodemic”—the over-abundance of information regarding an emerging event [2]—has been observed during prior public health emergencies [3–5]. During the COVID-19 pandemic, infodemics have reached unprecedented levels, and governments, and public health organizations around the world are now calling for measures to limit their effects [6].
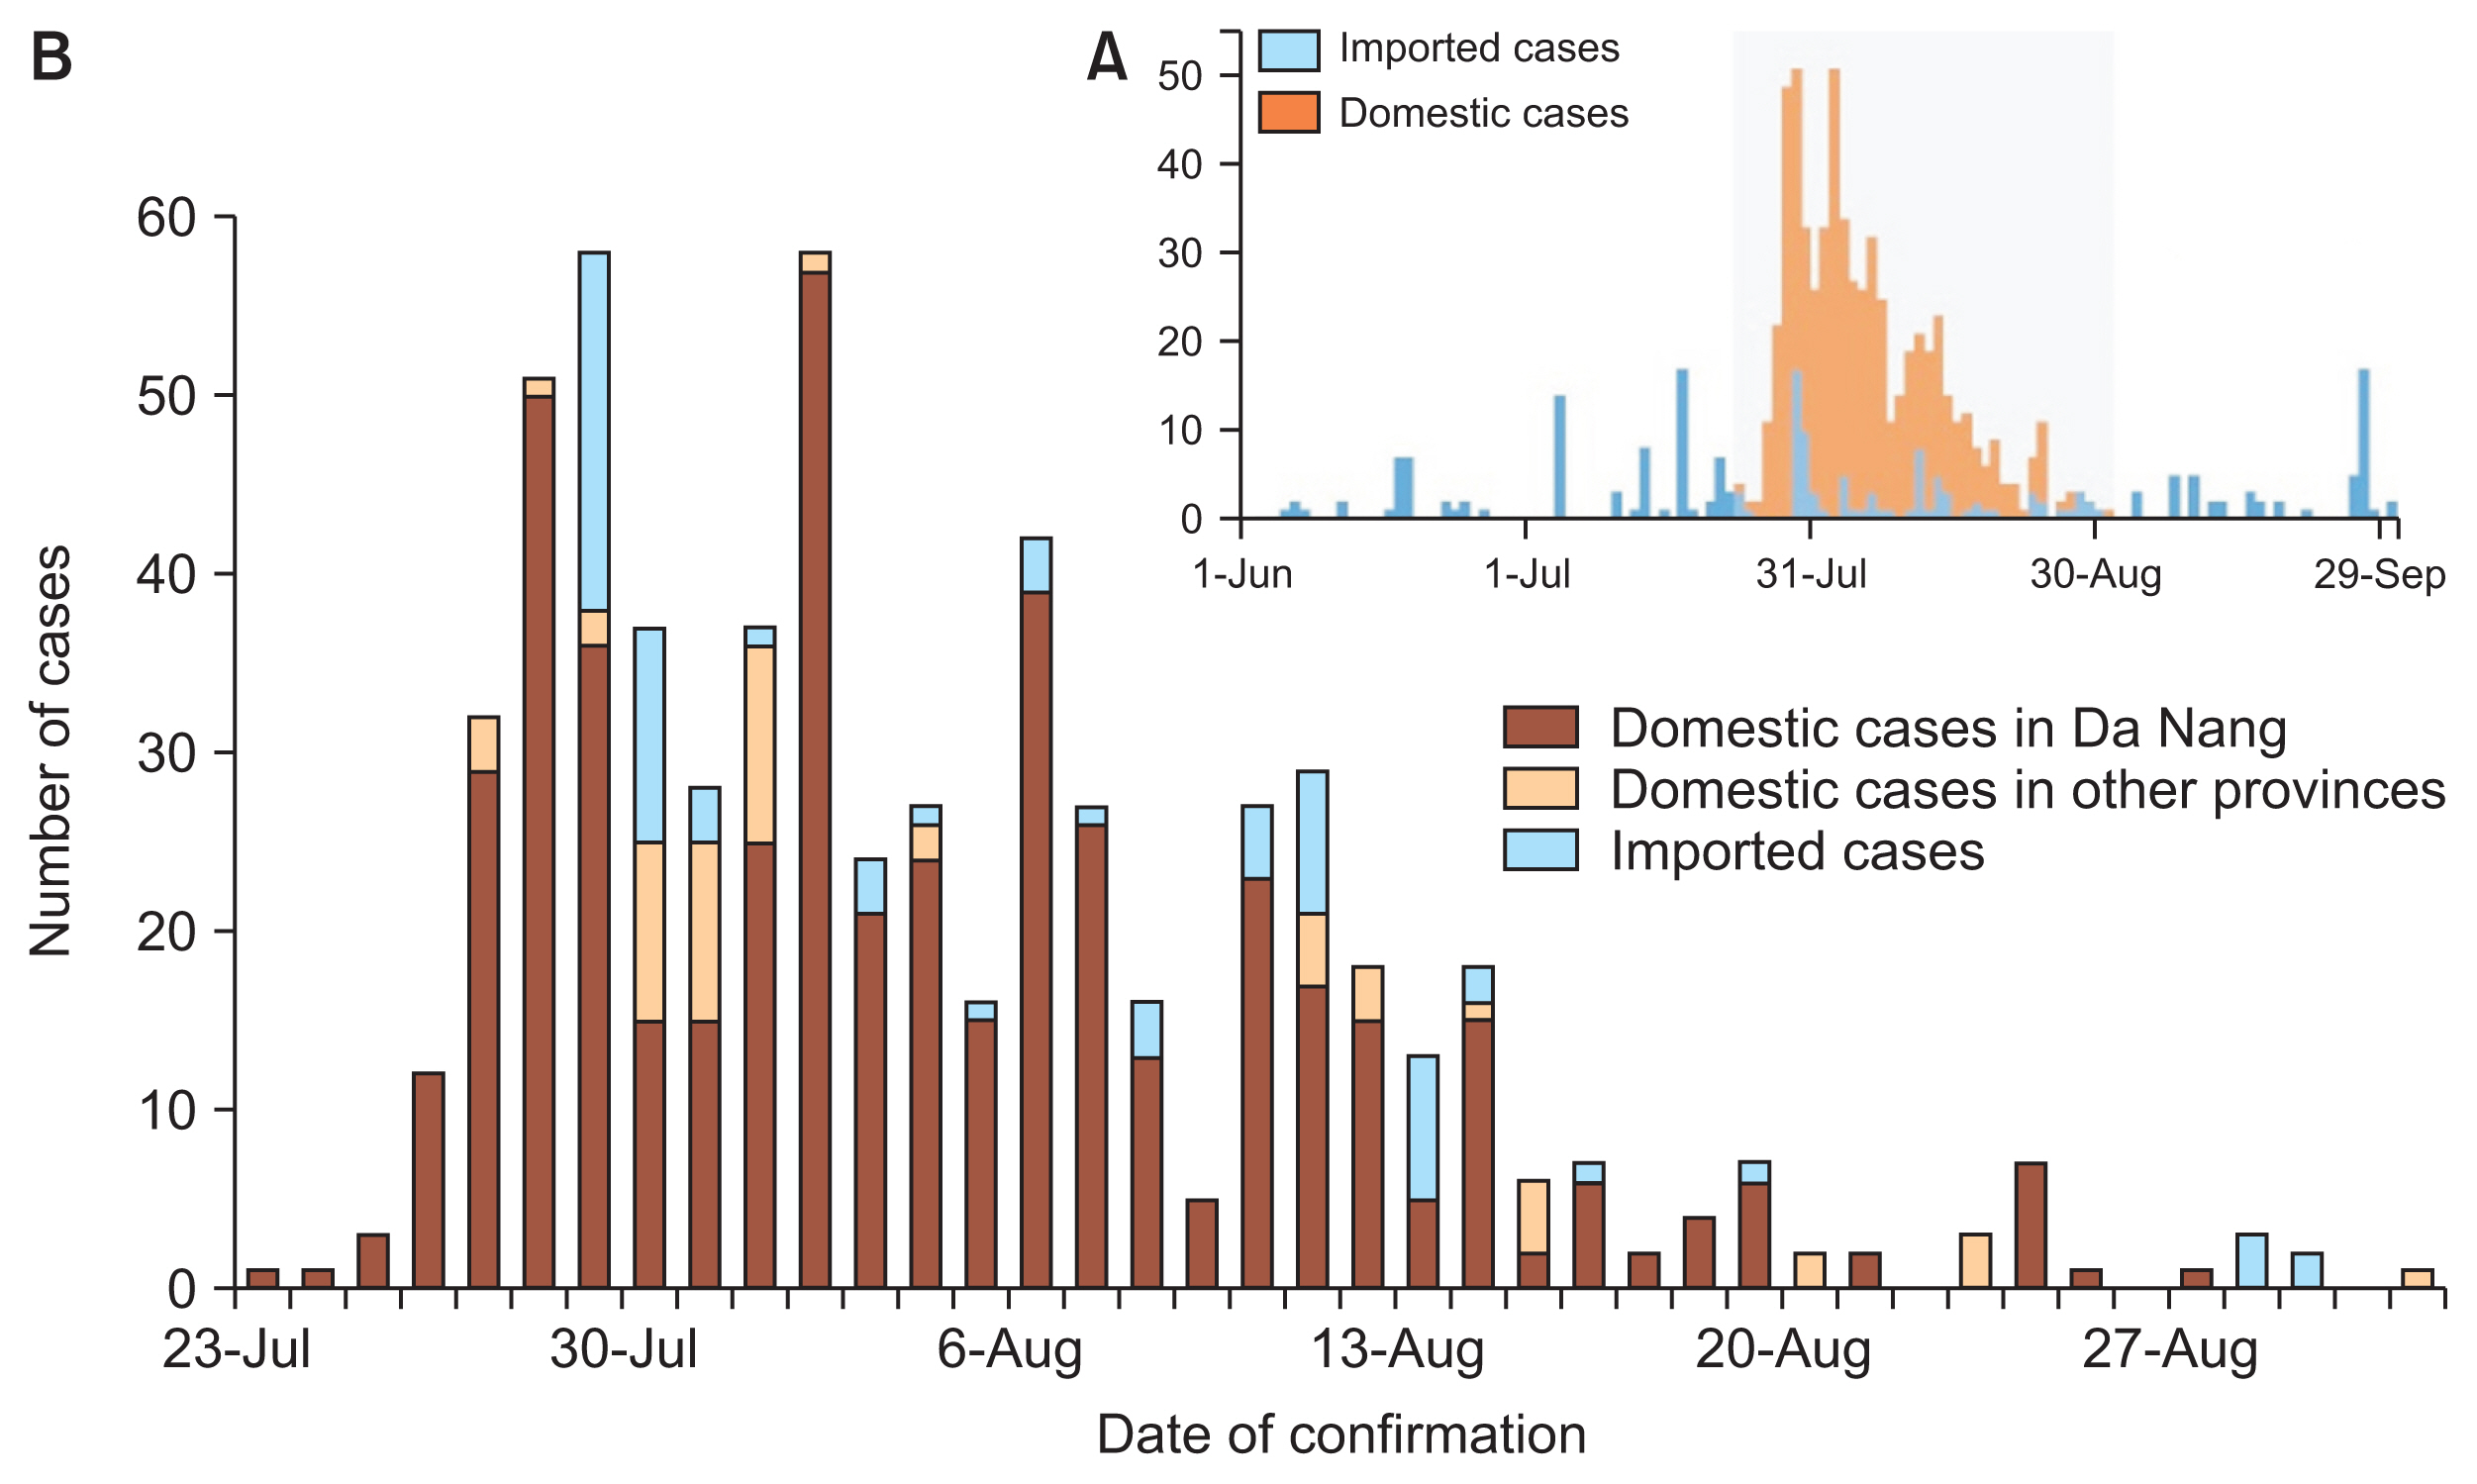
Vietnam was one of the first countries that reported COVID-19 cases outside of mainland China. Very early into the epidemic, many interventions were put in place before any cases were reported, including border closures and travel restrictions, extensive case detection and contact tracing, and stringent quarantine measures. A series of public health interventions were gradually and promptly imposed to control the outbreak domestically [7], helping Vietnam to achieve 99 days without community transmission between April and late July 2020 (Figure 1). On July 25, 2020, a surge of unlinked COVID-19 cases without evidence of imported infection from abroad was spotted in Da Nang, a municipal city in Central Vietnam of high importance for foreign trade and tourism [8]. The outbreak affected mostly patients and staff linked to several hospitals, people in the community of Da Nang, and sporadic cases among people in other provinces with a travel history to Da Nang. Overall, more than 500 cases were reported in relation to this outbreak, with 495 (89.84%) in Da Nang, and 56 (10.16%) in 10 other provinces and cities across Vietnam. It was the first outbreak in Vietnam with COVID-19-related deaths since the beginning of the pandemic, with a total of 35 related fatalities. By the end of August 2020, the Da Nang outbreak was declared under control.
A series of public health measures were implemented by Vietnam government in response to this outbreak to limit and prevent further spread [7]. While some of these measures had already been introduced before the outbreak, the scope and enforcement were greatly intensified due to the urgency of this outbreak. To keep the public informed, information about these policies was frequently broadcasted by governmental agencies and various other outlets, including online platforms. Many of the estimated 69 million internet users in Vietnam (more than 73% of the population) use online media and user-generated online information as their main source of information about current events [9]. It is therefore important to recognize online information as a crucial means of communicating about health and risk during a COVID-19 outbreak, and to understand its capacity to impact public adherence to public health interventions.
Most online platforms do not fact-check user-generated online information, which creates an opportune environment for misinformation, defined in the field of public health as a “claim of fact that is currently false due to a lack of scientific evidence” [10], to spread widely with no curation or verification. The viral ability of misinformation becomes amplified by the rapidly reciprocating nature of internet, and misinformation is easily content-tailored for specific target audiences that are receptive to specific types of misinformation [11]. In addition, the interplay between sentiment and misinformation to spread certain agendas is a serious concern of researchers and policy-makers [12,13]. Existing evidence suggests that strong and polarized sentiments in online content play an important role in amplifying and driving the spread of misinformation [14,15]. Nonetheless, the sentiment profile of misinformation surrounding COVID-19 is still inconclusive. It has been recognized that online misinformation during the COVID-19 pandemic can create either a false sense of security or threat, and thus impact public health prevention and control efforts [16]. Existing evidence about online misinformation about COVID-19 is restricted to the evolution of the pandemic, conspiracy theories, or discriminative misinformation [17,18]. However, the infodemics surrounding specific public health interventions imposed by governments have not been studied. The World Health Organization recently published a research agenda to improve evidence-based tools, methods, and interventions for infodemics management [19]. This agenda highlighted the need to first measure and detect the spread and impact of misinformation in a localized context during the ongoing epidemic. In line with these priorities, we aimed to analyze the magnitude and sentiment dynamics of misinformation and unverified user-generated online information about five distinct public health interventions in response to the COVID-19 outbreak in Da Nang, Vietnam, between July and September 2020.
II. Methods
1. Study Design
This longitudinal study used publicly available online information about COVID-19-related public health interventions from July 1 to September 15, 2020 on popular online platforms in Vietnam. We divided the study period according to three phases: pre-outbreak (July 1–24 2020), during the outbreak (July 25 to August 31, 2020), and post-outbreak (September 1–15, 2020). The “during” period was defined as extending from the date of the first laboratory-confirmed case in Da Nang to the date the outbreak was declared over by the Vietnam Ministry of Health. The other periods were chosen conveniently relative to the “during” period as time intervals that also contained relevant discussions about the interventions.
The study topics included the five main public health interventions, which came as directives from national-level Ministry of Health in response to this outbreak and were implemented at a national scale during the study period:
Cordon sanitaire of outbreak areas including the city of Da Nang and a nearby province;
Re-scheduling of the national high school examination nationwide and the exclusion from the examination of students from outbreak areas and/or students who were identified as COVID-19 cases or close contacts of COVID-19 cases;
Nationwide campaign to promote the use of Bluezone, Vietnam’s official contact tracing mobile phone application for COVID-19;
National tracking and prosecution of illegal border-crossing and individuals who breached COVID-19 quarantine requirements; and
National contact tracing, serologic testing, and quarantine for all people with a travel history involving the outbreak areas.
2. Data Collection
The inclusion criteria for data collected in the analysis were contents (1) made in public mode during the study period that remained public at time of data collection; (2) made and posted in the format of online newspapers, online forums or social media posts; and (3) had a verified postal area of operation in Vietnam. Our search was limited to online posts in Vietnamese. Data were provided by the Ministry of Science and Technology through an internet archive database named the Social Media Command Center. The research team developed keywords for data collection that were compiled into a list (Supplementary Table S1). We then used the keywords in the system to collect online information from several sources (including social media platforms, online forums, and online newspapers) operating in Vietnam (Supplementary Table S2). Based on the topics identified using the keywords, the following variables of online information were collected: source, period, number of engagements, influence score, and text (definitions in Supplementary Tables S3 and S4). The influence score was categorized into 10 categories according to the number of followers and/or views of the source of the post (Supplementary Table S4). The number of engagements was defined by the sum of all interactions with the posts by users/readers in response to the content of the post. The collected data were compiled and extracted into Microsoft Excel by personnel from the Ministry of Science and Technology, and no identifiable data were collected.
3. Data Processing
We selected the 100 posts with the highest number of engagements from each of the five topics, which yielded 500 posts for analysis. From these 500 selected posts, the following variables were manually collected/categorized by the research team and further processed. First, we conducted a content classification to categorize these posts based on textual content into the following categories: genuine information, misinformation, opinions, and unverified information. These categories were adapted from previous research by Kouzy et al. [20] on COVID-19 Twitter data and defined in Table 1. Two researchers independently followed the definition to categorize all selected posts separately by reading each post’s textual content. The final results were cross-checked between two sets, and any disputes were handled through consultation with a third researcher and an additional information search. No posts were excluded after the process due to an unresolved dispute.
Next, we conducted sentiment classification based on the textual content of selected posts. All selected posts underwent for sentiment analysis using a Vietnamese sentiment lexicon [21] and VnCoreNLP packages [22] for Vietnamese-language word and sentiment processing in Python 3.6. For each post, the number of positive and negative words that appeared was calculated. Each post was further classified into one of three sentiment categories (positive, neutral, or negative) based on an automatic calculation of the sentiment score of each post.
4. Data Analysis
The variables were summarized and plotted chronologically by date of the posts according to the timeline of the outbreak and/or interventions implemented and differentiated between content categories by appropriate statistical tests. We used negative binomial regression to explore the relationship between the number of engagements and selected posts’ characteristics; the incidence relative risk (IRR) and 95% confidence interval (CI) were calculated. Univariate and multivariable logistic regression were used to explore the association between posts’ characteristics and posts’ categories, focusing on misinformation and unverified information versus other post categories; for this analysis, the odds ratio (OR) and 95% CI were reported. The median number of negative and positive words stratified by posts’ characteristics were summarized and differentiated using analysis of variance. All analyses were performed using Stata version 16 (StataCorp, College Station, TX, USA).
III. Results
1. Descriptive Characteristics of All Collected Online Posts
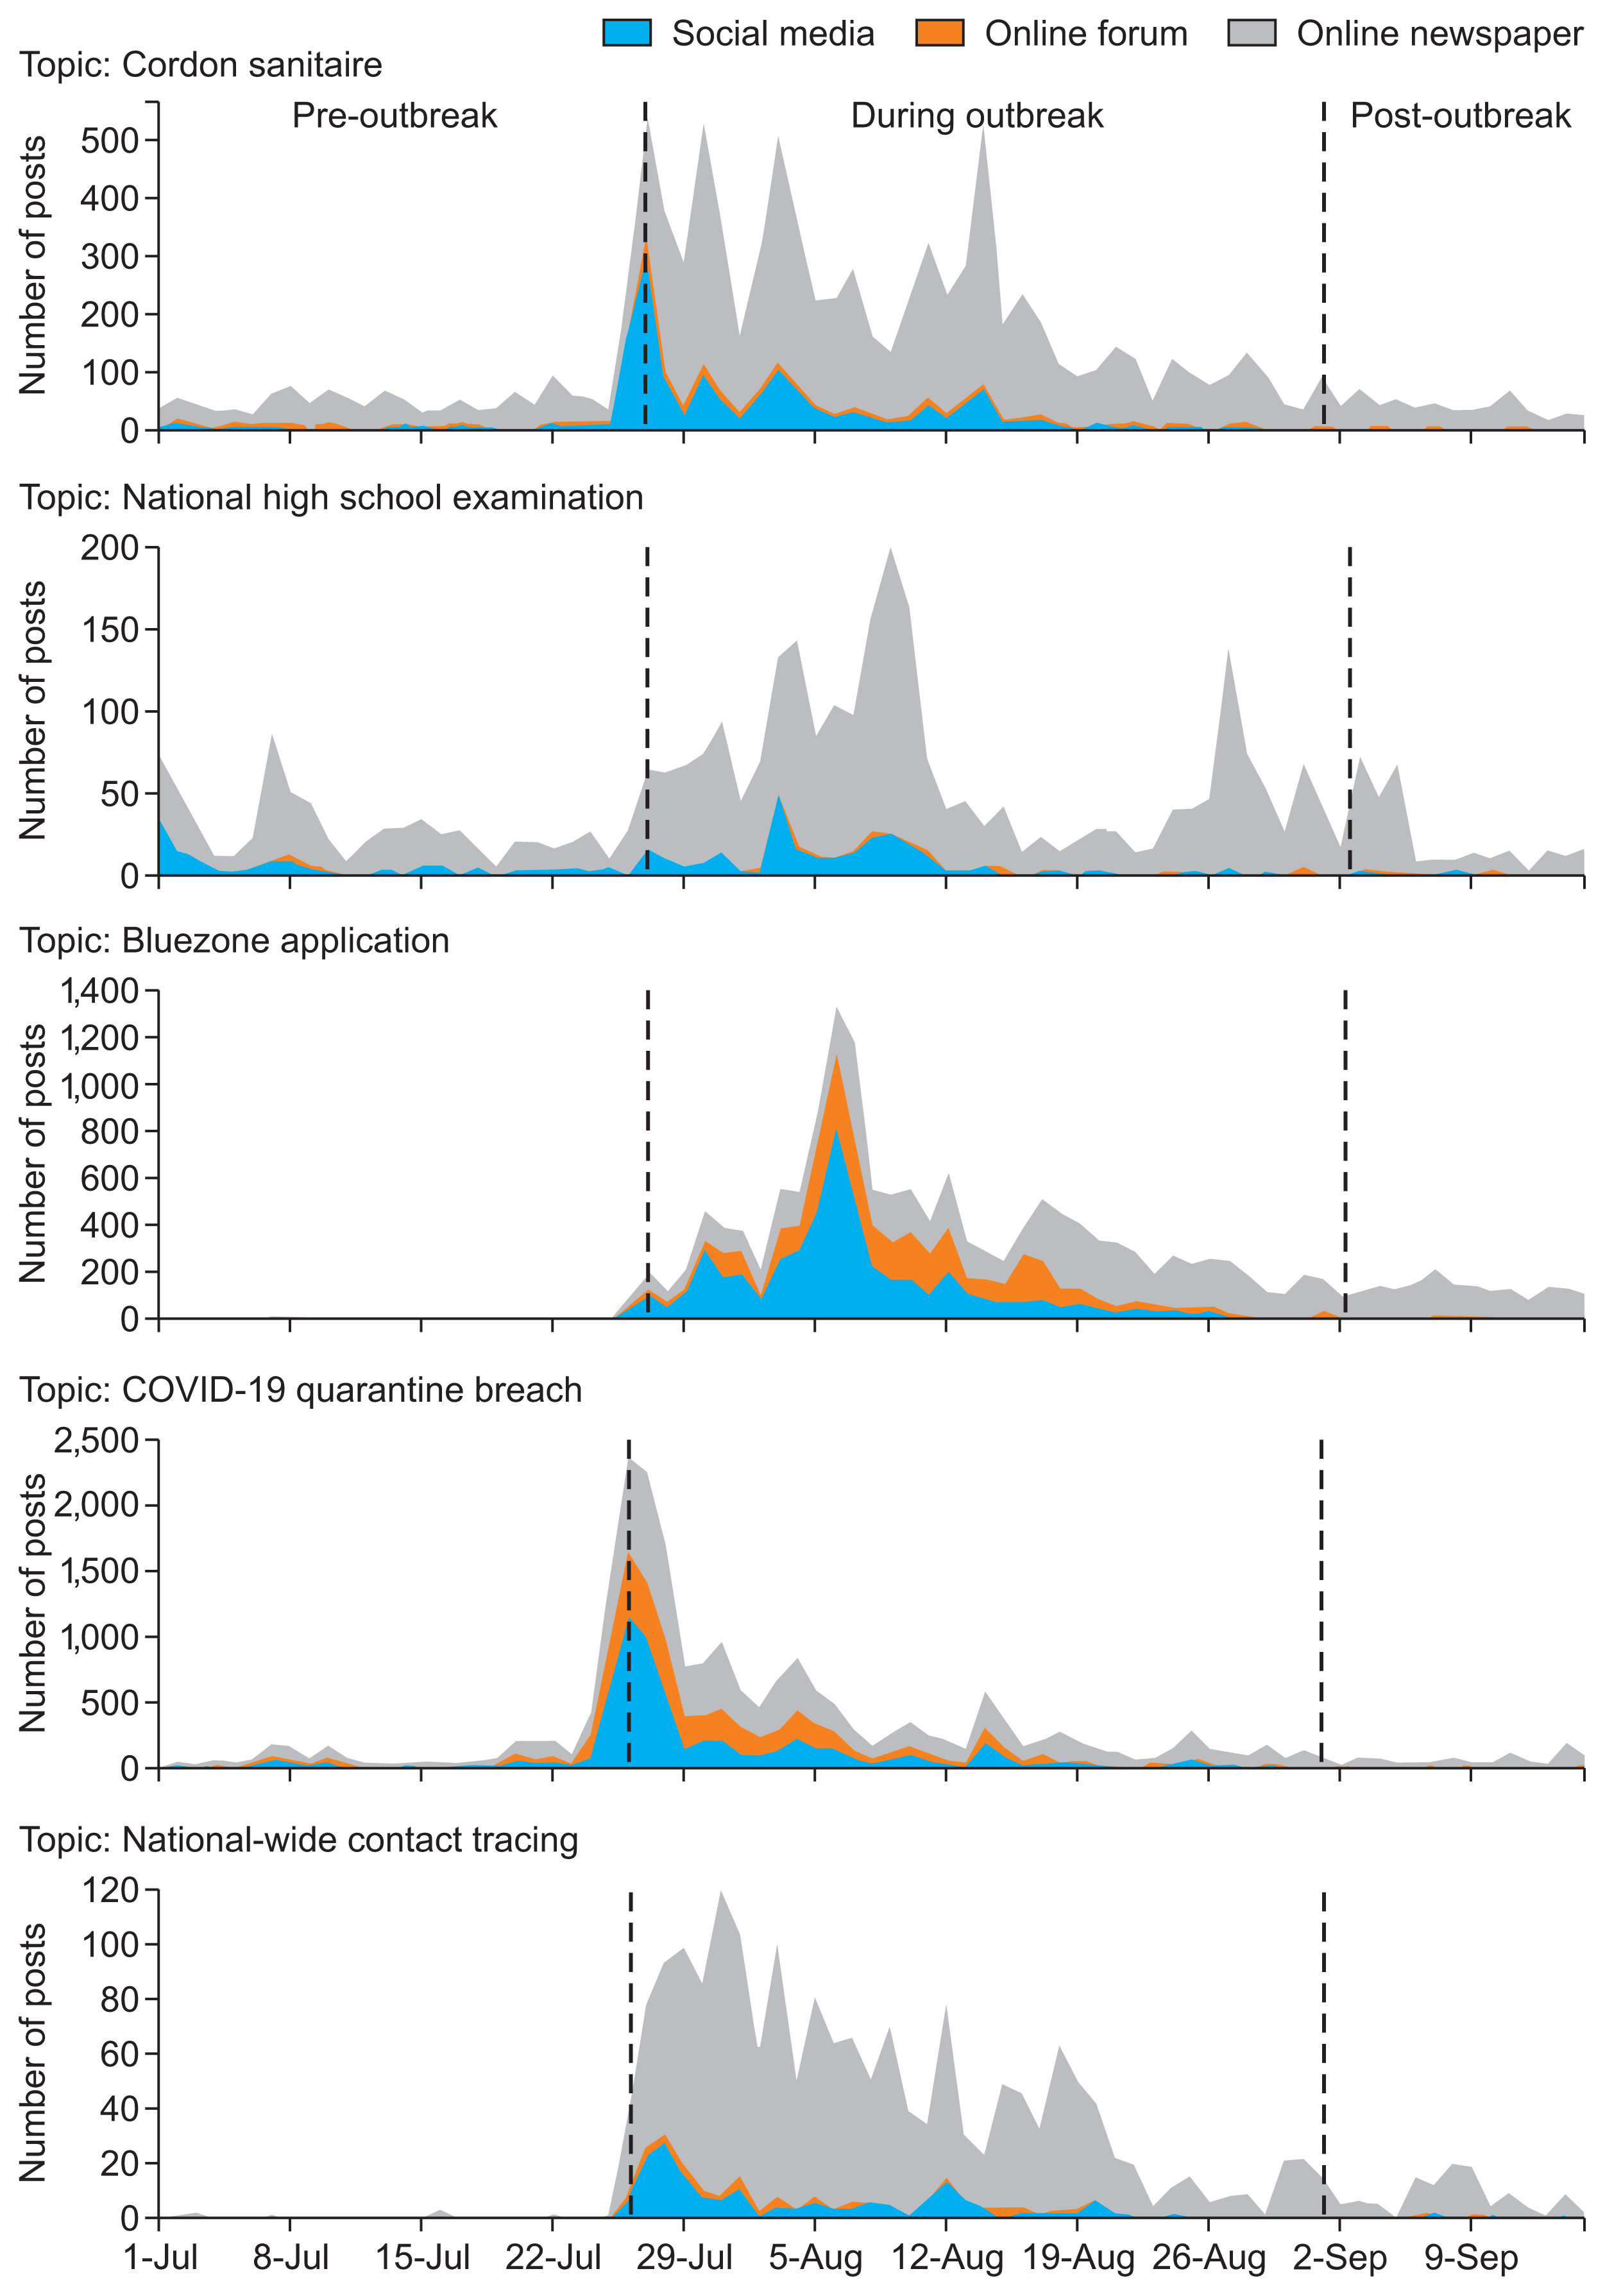
Table 2 and Figure 2 display the distribution of online posts’ characteristics stratified by search topics for five distinct non-pharmacological interventions implemented in Vietnam during the study outbreak. Across the five topics, the “COVID-19 quarantine breach” discussion had the highest number of posts (n = 22,170), the highest number of posts made per day (287.92 posts per day), and the highest median of engagements (180.81 engagements per post). Meanwhile, posts concerning the “national high school examination schedule” had the fewest engagements (36.82 engagements per post), and posts mentioning “nationwide contact tracing” were posted least frequently during the study period (33.61 posts per day). While “cordon sanitaire” information was posted by sources with the highest influence scores compared to the other topics (5.00 ± 3.38), the opposite was true for information about the “Bluezone application” (3.91 ± 3.02). Figure 2 shows that while the highest numbers of posts were made during outbreak for all five topics, online newspapers were the most consistent source reporting the highest number of posts about these topics. The number of posts about the “Bluezone application,” although it had the lowest traffic before the outbreak, increased drastically during the outbreak and even reached the highest rank among the five topics after the outbreak (Table 2). A similar trend was observed for posts on “nationwide contact tracing.” In contrast, the remaining three topics saw a considerable decline in the number of posts after the outbreak, reaching a volume that was even lower than before the outbreak.
2. Descriptive and Analyzed Characteristics of Selected Online Posts
Table 3 presents the characteristics of all selected posts stratified by the posts’ categories. Among the selected 500 posts with the highest number of engagements, there were 316 (63.20%) genuine information posts, 10 (2.00%) misinformation posts, 152 (30.40%) opinions, and 22 (4.40%) unverified posts. The highest number of engagements was observed for unverified information (median, 13,415; interquartile range, 8,507–22,869). The highest number of genuine information and opinion pieces were made in newspapers and during the outbreak. Most posts identified as neutral in terms of sentiment (196/207) were categorized as genuine information, while most posts classified as having positive sentiments (81/147) were opinion-expressing posts. Meanwhile, most misinformation posts were made on social media (8/10), and half of the posts with unverified information (11/22) were posted on online forums. While all identified misinformation posts were made during the outbreak, none of these posts were made with a neutral sentiment or on an online newspaper platform. Similarly, the identified unverified information posts did not display neutral sentiments and were not posted after the outbreak.
Negative binomial regression was conducted, as shown in Table 4, to demonstrate the association of identified posts’ categories and number of engagements, adjusted for several characteristics. The number of engagements for unverified information was significantly higher than that for genuine information, with an IRR of 2.83 (95% CI, 1.33–6.02), and this relationship remained significant after adjusting for the source, time periods, and sentiment of the posts. The adjusted model of posts’ categories showed that online information published during the outbreak received significantly higher numbers of engagements than online information published before or after the outbreak—IRR = 0.15; 95% CI, 0.07–0.35 and IRR = 0.46; 95% CI, 0.34–0.63, respectively. After controlling for sentiment, the number of engagements of neutral posts was significantly higher than that of positive posts (IRR = 0.60; 95% CI, 0.37–0.97) and significantly lower than that of negative posts (IRR = 1.84; 95% CI, 1.23–2.75).
3. Analysis of Identified Misinformation and Unverified Information
Table 5 shows multivariable logistic regression for the distribution of posts’ characteristics (source, sentiment polarity, and time period) between identified misinformation and the other post categories (model 1) and between unverified information and other post categories (model 2). Negative posts were significantly more likely to be misinformation (OR = 9.59; 95% CI, 1.20–6.70) or unverified information (OR = 5.03; 95% CI, 1.66–15.24) than positive posts. There were no significant differences in the probabilities of posts made in different time periods or made by different sources being misinformation or unverified information.
4. Sentiment Analysis of Selected Online Posts
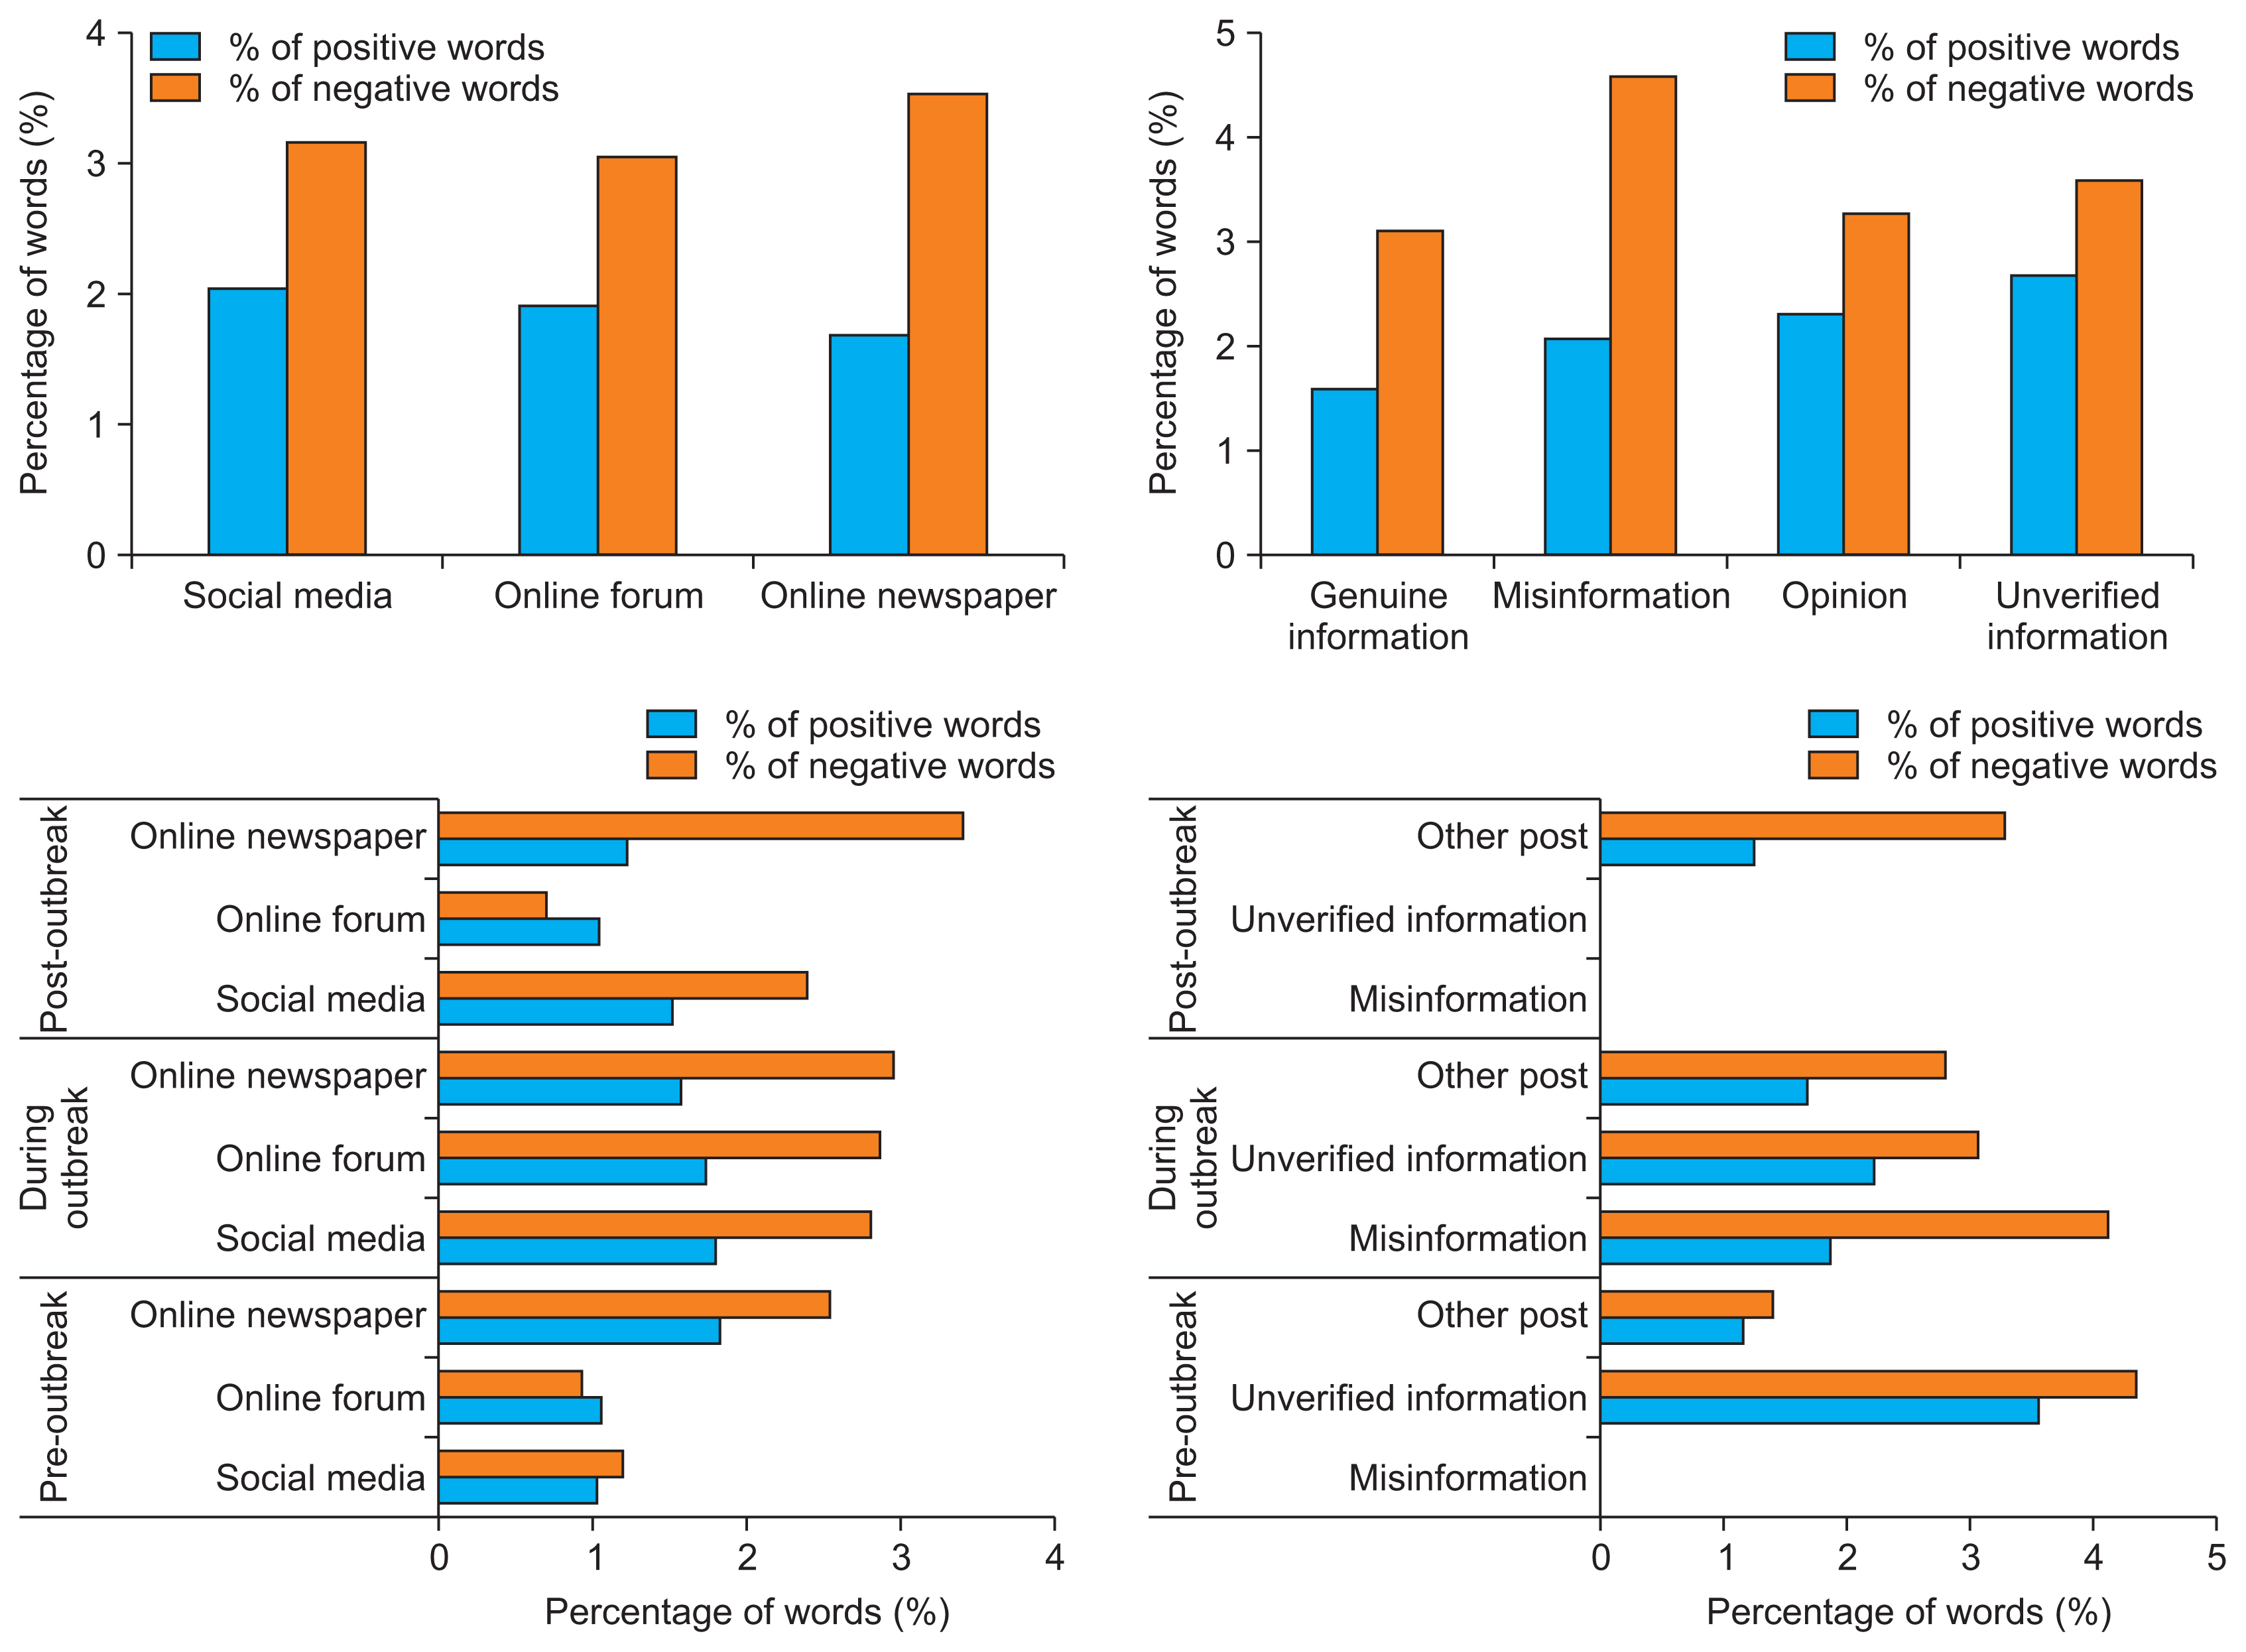
There were 2,660 positive words and 4,748 negative words used in the 500 selected posts. More common use of negative words than positive words was observed across all post categories, sources, and time periods (Figure 3). Significantly higher numbers of negative words were used in online newspapers, after the outbreak, and in misinformation and unverified information (Supplementary Table S5). A significantly higher number of positive words was also found in posts reporting misinformation and unverified information than in the other categories.
IV. Discussion
We found a low volume of misinformation and unverified information among online information about public health interventions during the Da Nang COVID-19 outbreak. Online posts containing unverified information and misinformation were more likely to have negative sentiments and contain a higher number of negative or positive words, and unverified information received higher engagement than other post categories.
Our study reported lower rates of misinformation than previous studies of COVID-19 or other recent epidemics [23,24]. This might be explained by the previous research of Gallotti et al. [25], who found a lower risk of infodemics in countries with stable political contexts and consistent public health interventions and messages throughout the epidemic. In 2020, Vietnam was regularly praised for its strict measures in response to COVID-19 and achieved one of the lowest COVID-19 infection and fatality rates globally. This success might have mitigated infodemic spread in Vietnam.
Many other studies on infodemics and misinformation in the COVID-19 context focused solely on Twitter [3,26]. Meanwhile, our study extended to all publicly available incountry online information, and beyond social media platforms, it included online newspapers and online forums, both of which are powerful information dissemination outlets in Vietnam. This thereby helped reflect online information flow outside the main international platforms that were used in previous research. Through this, we found that online forums and online newspapers were also a source of misinformation and unverified information. This highlights the gap in current research on COVID-19 misinformation, and also the need for infodemic control by public health agencies.
We found a strong relationship of misinformation and unverified information with sentiment polarity. This finding is in line with the study of Shahi et al. [27] on COVID-19 misinformation on Twitter, which showed that false claims featured more negative emotions than other news. In this study, more polarizing sentiments in misinformation were also closely related to the number of engagements of posts, which was also observed in previous studies on the number of retweets of COVID-19 information [28,29]. Our study showed that both unverified information and posts with negative sentiment received higher engagements than other posts. Similar conclusions were drawn from other studies on COVID-19, showing that negative information received more retweets [30]. Misinformation relies heavily on the implication of uncertainty and ambiguity of the situation, and it creates fear, anxiety, or negative emotions in readers through its content. This may also explain the observation of higher engagements for online information during the outbreak, the time that the general public might have perceived the most uncertainty towards the outbreak’s evolution, as well as the many measures implemented to contain it. Yet, this phenomenon of higher engagement for unverified information indicated that false or partially false information was more likely to spread and engage users. This implies not only the wide spread of misinformation, but also the danger of infodemics during times of uncertainty during the pandemic. Public health agencies, governments, and leaders should recognize this threat and strategize to effectively counter misinformation and unverified information, as the role of health education is crucial during pandemic times.
Our study was subject to several limitations. We did not explore in more detail the account characteristics or the semantics used, which would have given a more comprehensive depiction of not only the content of the posts, but also the entities that spread such information. We also limited our analysis to three sentiment statuses (positive, negative, or neutral). A more in-depth study on post sentiments might have captured more accurately the emotions underlying the generation of online information, and more importantly, misinformation. Thirdly, we selected only the 500 most influential posts among all collected posts due to limited resources for data processing. Forth, due to the nature of a retrospective study, the accurate rate of information in real time during the outbreak might not have been captured since some information might have been retracted or deleted. Moreover, our study was limited to only five distinct public health interventions over a short period of time, which might affect the generalizability of the findings. Nevertheless, we believe that, overall, our study offers a robust and valid analysis of an online infodemic related to a serious public health threat during the ongoing COVID-19 pandemic.
Our study provides important evidence about the volume and sentiment dynamics of misinformation and unverified information as part of the online infodemic during the ongoing COVID-19 pandemic. While the volume of incorrect or unverifiable online information was low overall, we showed that social media were not the only affected type of online platform. The choice of words, sentiment, and influence of the source had strong impacts on their distribution. This study offers important insights for public health decision-makers in Vietnam and other countries in the region with high rates of internet use to understand the public perceptions of health interventions in response to COVID-19.