Cancer Risk Score Prediction Based on a Single-Nucleotide Polymorphism Network
Article information

Abstract
Objectives
Genome-wide association studies (GWAS) are performed to study the associations between genetic variants with respect to certain phenotypic traits such as cancer. However, the method that is commonly used in GWAS assumes that certain traits are solely affected by a single mutation. We propose a network analysis method, in which we generate association networks of single-nucleotide polymorphisms (SNPs) that can differentiate case and control groups. We hypothesize that certain phenotypic traits are attributable to mutations in groups of associated SNPs.
Methods
We propose a method based on a network analysis framework to study SNP-SNP interactions related to cancer incidence. We employed logistic regression to measure the significance of all SNP pairs from GWAS for the incidence of colorectal cancer and computed a cancer risk score based on the generated SNP networks.
Results
We demonstrated our method in a dataset from a case-control study of colorectal cancer in the South Sulawesi population. From the GWAS results, 20,094 pairs of 200 SNPs were created. We obtained one cluster containing four pairs of five SNPs that passed the filtering threshold based on their p-values. A locus on chromosome 12 (12:54410007) was found to be strongly connected to the four variants on chromosome 1. A polygenic risk score was computed from the five SNPs, and a significant difference in colorectal cancer risk was obtained between the case and control groups.
Conclusions
Our results demonstrate the applicability of our method to understand SNP-SNP interactions and compute risk scores for various types of cancer.
I. Introduction
According to the World Health Organization (WHO), cancer is the second leading cause of death, with 9.6 million deaths in 2018 worldwide [1]. Lung cancer is one of the most common types of cancer, with 2.26 million incident cases and 1.80 million deaths globally in 2020 [2]. Mesothelioma, pancreatic cancer, and brain cancer are the cancers with the lowest 5-year survival estimates cancers [3]. The fight against cancer is particularly difficult in low- and middle-income countries, as approximately 70% of cancer deaths occur in these countries [1]. However, this fact shows that modern medicine and advanced health services have improved the survivability of cancer patients. Most cancers can be cured in the early stages; however, after metastasis, cancer becomes almost incurable, underscoring the importance of early detection [4]. Fortunately, cases of cancer can be identified even before they turn malignant [5]. Nevertheless, cancer prevention strategies (e.g., a healthy diet and lifestyle) are still a better approach, since tobacco use, alcohol consumption, dietary intake, and lack of physical activity are among the main leading causes of cancer [6–9].
Genome-wide association studies (GWAS) have revealed many significant markers or single-nucleotide polymorphisms (SNPs) that have associations with certain types of cancer, including colorectal cancer in our previous research [10]. Most of these studies used sex, age, lifestyle, and diet as confounding variables. These findings indicate that some people are prone to develop cancer even with a fairly healthy lifestyle. The genetic variants associated with phenotypic traits or the risk of complex diseases such as cancer have been researched using GWAS to identify SNPs with significant associations. However, these associations have a limited capability to explain genetic risk or disease heritability because they only account for a small fraction of the genetic aspects in both traits and the disease risk; this gap is termed “missing heritability” [11]. Interactions among genetic variants (i.e., SNP-SNP interactions) have been suggested in many studies as a factor that may account for a substantial proportion of complex disease susceptibility. Several breast cancer studies have found that selected SNPs from genes related to cancer mechanism pathways may weakly contribute to the cancer risk individually, but their interactions demonstrated significant associations with breast cancer risk [12]. In another study, Lin et al. [13] identified SNP-SNP interactions in angiogenesis-related gene pairs that were associated with prostate cancer severity and constructed a gene interaction network based on those results to identify genes involved in the angiogenesis pathway. Similarly, Goodman and Weare [14] identified SNP-SNP interactions that contribute to colon cancer risk using polymorphism interaction analysis. The selected SNPs obtained from case-control data include SNPs with a weak contribution to colorectal cancer risk and even individual SNPs that did not contribute to colon cancer risk. Jiao et al. [15] conducted a genome-wide study of gene-gene interactions and colorectal cancer risk from GWAS data using the average risk due to interaction method. They showed evidence of two pairwise SNP-SNP interactions that were significantly associated with colorectal cancer risk.
Biological data including DNA structure, RNA expression, and protein expression, offer a vast amount of interactions that can be analyzed to generate hypotheses on the underlying biological phenomena of certain traits or diseases. Data interactions are often analyzed using a network analysis approach. This approach was originally used in the social sciences, with representative applications including person-person or social media interactions [16]. However, the emergence of big data availability in the life sciences domain prompted researchers to implement this approach to investigate hidden patterns within data [17]. A Bayesian network model was developed to illustrate SNP-gene-trait interactions from microarray data [18]. This model used a Bayesian rule to filter the SNPs and genes to be included in the network. A more recent study built a model based on the pairwise correlations of each SNP [19]. Only SNPs with correlation scores exceeding the designated threshold were included in the model. The approach resulted in a network with highly interconnected nodes. The application of a threshold for inclusion is a crucial part of the methodology because the number of SNPs included in the model can significantly affect the computational power needed to run the model.
In our previous studies, we reviewed some approaches to enhance the accuracy of polygenic risk scores. We tried Bayesian approaches [20] and deep learning [21], and we also reviewed the reliability of polygenic risk scores based on reported biomarkers from different populations [22]. Based on the lessons from our previous studies, we propose a novel method to find or filter SNPs with significant associations. Specifically, we propose a network analysis method, where we generate SNP association network(s) that can differentiate samples from case and control groups. We hypothesize that the risk score for developing a certain type of cancer is affected by mutations in groups of SNPs that are associated and have SNP-SNP interactions instead of being solely affected by a single mutation, as assumed in GWAS. Although this method can be applied to all types of cancer and even for other phenotypic traits, in this study we applied this method to a small dataset since our method requires tremendous computation power. We implemented our method on GWAS colorectal cancer results as a proof of concept. In the future, we will test our method on a larger dataset and other cancers.
II. Methods
1. Dataset
The dataset of this study was already used in our GWAS of colorectal cancer in the South Sulawesi population array [10], which consists of 173 samples with 89 colorectal cancer cases and 84 healthy controls genotyped by the Smokescreen genotyping array [23]. The majority of the samples are from self-reported South Sulawesi locals, and the rest of them are from residents of Java Island, which can be classified as a Southeast Asian population. The ethnicity of the participants was used as a confounding variable in our analysis. Another confounding variable, the ancestry estimation, was computed using the fastStructure 1.0 algorithm [24]. The demographic characteristics of the samples are summarized in Table 1. The use of the data was approved by the Hasanuddin University Ethical Committee (No. UH 15040389). Since this was a proof-of-concept study, we applied our concept to a small dataset. Thus, we chose the top 200 SNPs with the lowest p-value results from the GWAS experiment, and we filtered these SNPs with the minor allele frequency threshold.

Demographic data of samples
2. Network Analysis
The significance of SNPs in GWAS is measured using the p-value of the SNPs generated from logistic regression. Confounding variables are usually added to the logistic regression analysis to minimize bias. We proposed a method that measures the significance of SNPs for the trait, colorectal cancer, with regard to their associations with other SNPs. Hence, we entered the SNP pairs in a logistic regression analysis with other confounding variables (sex, body mass index [BMI], smoking status, and race [African, American, European, East Asian, South Asian]), as shown in Equation (1). We measured the significance of the SNPs using the pvalues from logistic regression. However, if one of the SNPs’ p-value was larger than 1 × 10⁻⁵, the SNP pair was considered non-significant.
In GWAS, there are n logistic regressions, where n is the number of the analyzed SNPs. Since, in our method we paired all SNPs, we had an arithmetic series (1 + 2 + ... + (n – 1); n is number of SNPs) of logistic regressions.
Regional association plots for the top-hit SNPs were generated using LocusZoom [25]. This plot shows the association strength of all SNPs within 100-kb regions both to the left and the right of a top-hit SNP. The association strengths were obtained from our previous GWAS [10]. This method also provides information on known genes within this region. Additionally, association results from the GWAS catalogue in this region were also included for comparison with our own GWAS.
After all SNP pairs were regressed, the results were sorted based on the regression p-values. The 5% of SNP pairs with the smallest p-values were taken. However, we excluded SNP pairs that had a p-value larger than 1 × 10⁻⁵ for any of the SNPs. The SNP pairs that passed this filter were then used to create the SNP network and calculate the colorectal cancer risk score. Our step-by-step method and an example experiment are presented in Figures 1 and 2.
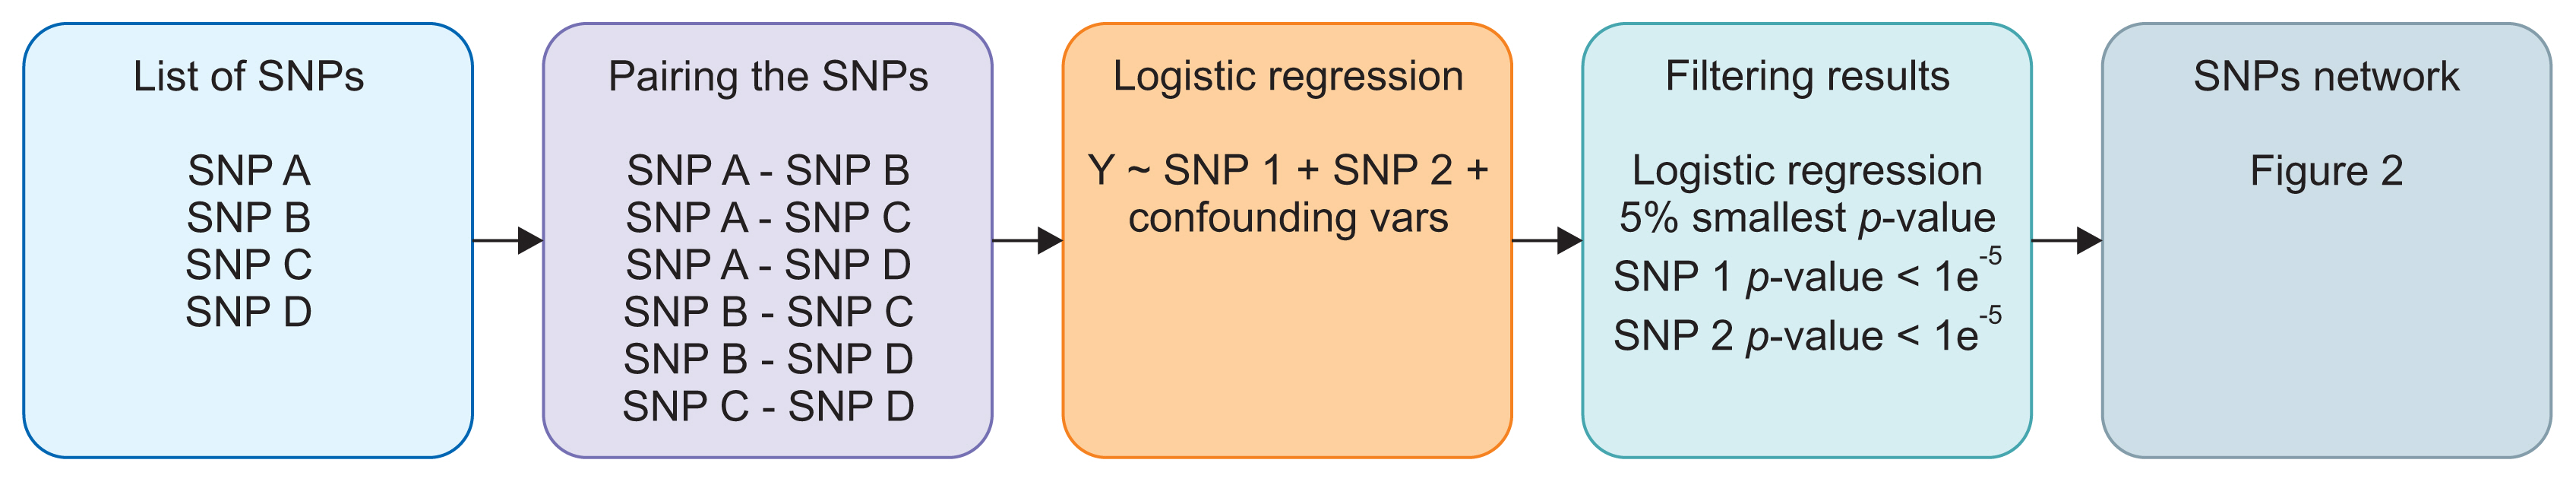
Network analysis workflow. SNP: single-nucleotide polymorphism.
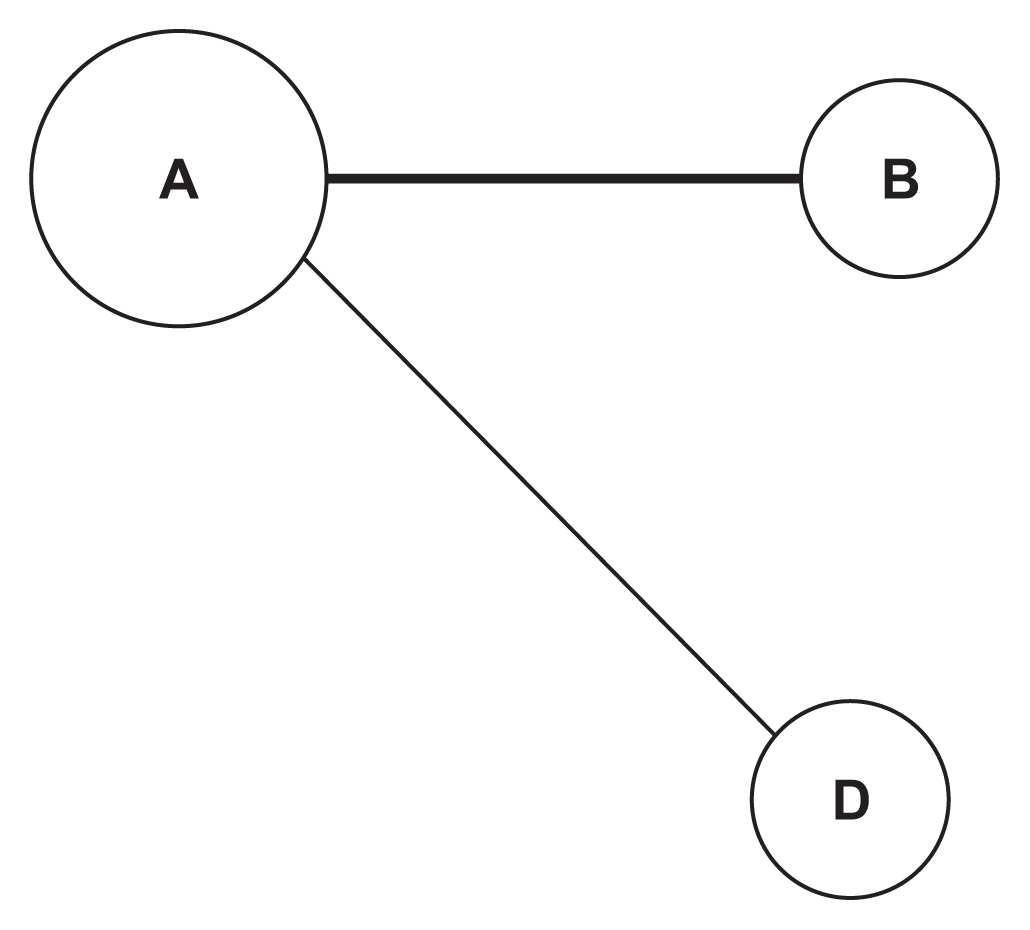
Example of a single-nucleotide polymorphism (SNP) network.
In that example, there are four processed SNPs: SNP A, SNP B, SNP C, and SNP D. Therefore, there are six SNP pairs that need to be regressed. After regression and filtering, only two pairs pass: SNP A – SNP B and SNP A – SNP C. These two pairs are then used to create the SNP network that can be seen in Figure 2. The thicker line that connects the SNP A node and the SNP B node means that the p-value of the logistic regression that uses this pair is smaller than the p-value obtained using the SNP A and SNP C pair. SNPs with more connections have larger nodes.
3. Risk Score Evaluation
To evaluate the risk score generated by the SNP pairs, the risk score was compared with other risk scores that were generated using another SNP-based prediction method. We calculated risk scores based on the SNPs with the lowest pvalues from our previous GWAS [10] as a comparable measure. To measure the effectiveness of the risk score, the t-test was used to compare the risk scores of the control and case groups. A smaller p-value from the t-test means that the risk score is more significantly different between the groups. A p-value of less than 0.05 was deemed to indicate a successful risk score.
III. Results
From 200 SNPs analyzed in the experiment, a total of 20,094 SNP pairs were generated. However, some pairs of SNPs had the exact same values across the sample. Their exclusion left 19,899 pairs of SNPs that could be made. Figure 3 shows the p-values produced from logistic regression of these SNP pairs that appeared to be normally distributed. From those 19,899 SNP pairs, only four pairs with five SNPs passed the filter. These SNPs were all interconnected to create one cluster of the SNP network, as shown in Figure 4. All the SNPs in the network are listed in Table 2.
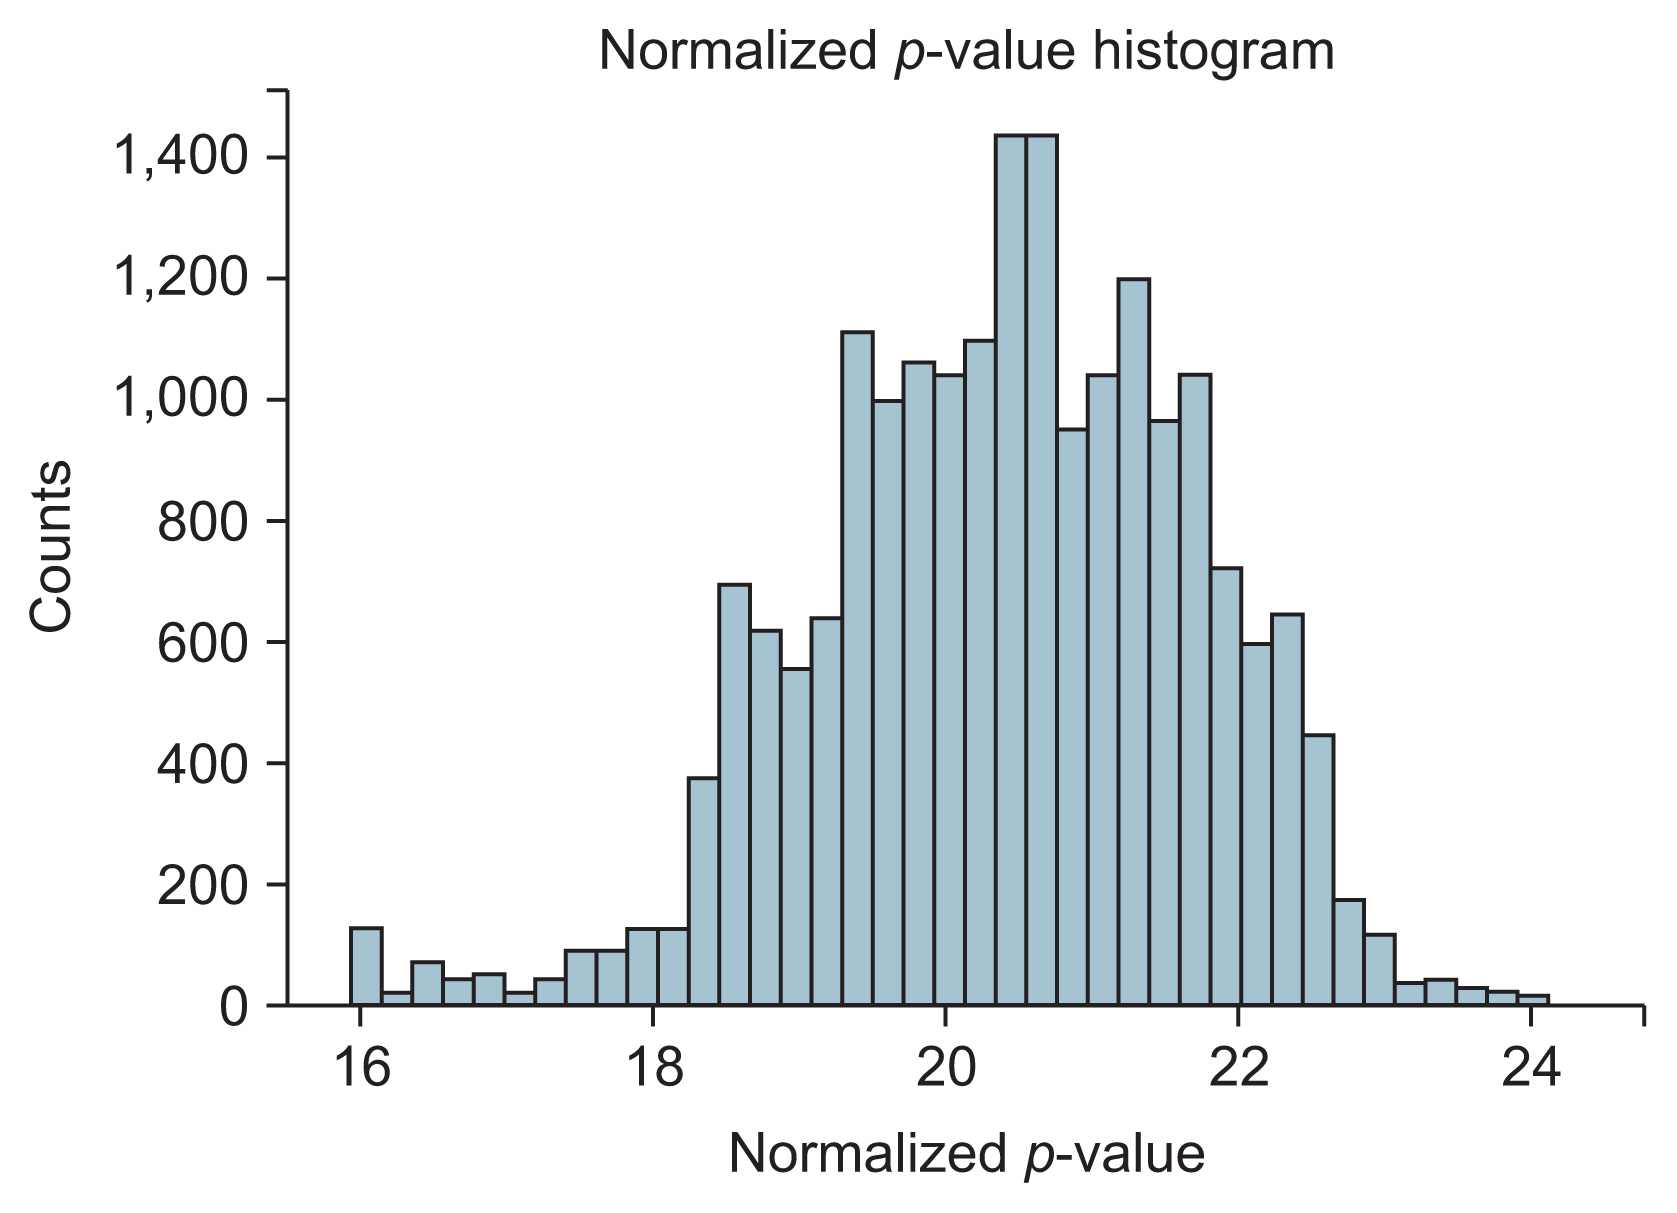
Normalized p-value distribution.
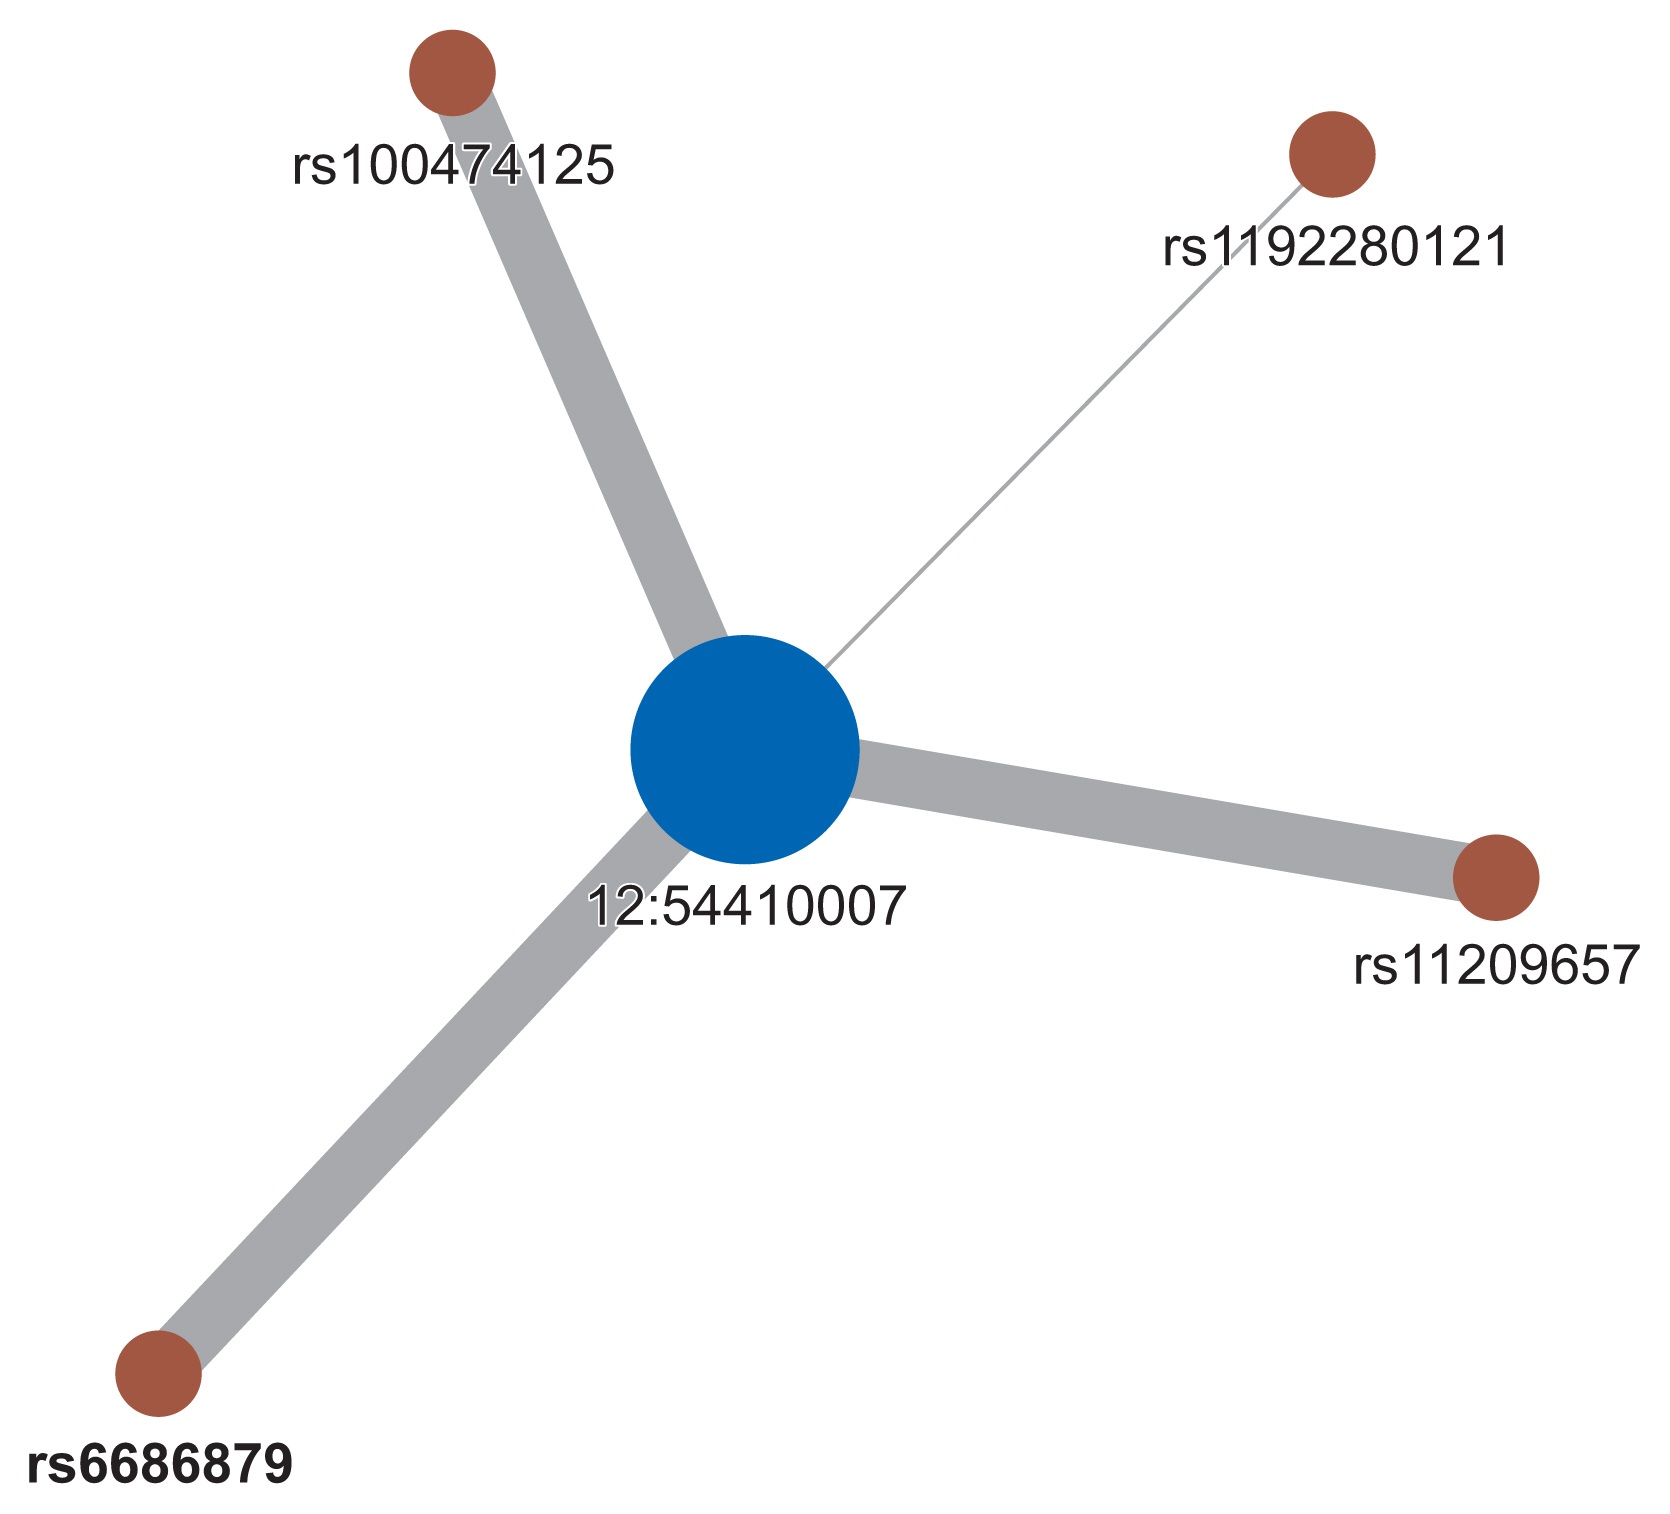
Generated single-nucleotide polymorphism (SNP) network with a 1 × 10⁻⁵ threshold.

List of filtered SNPs
IV. Discussion
The SNP network generated by our proposed method showed an interesting relationship. As presented in Figure 4, one locus on chromosome 12 (12:54410007) was connected to four variants on chromosome 1. Figure 5 shows the regional association plot for rs66868779 on chromosome 1. It includes three other SNPs that were found to be significant in our network analysis. No known genes are found in this region. The four intergenic variants from our network analysis are clustered in a close region, as illustrated in Figure 5. The regional association plot for SNP 12:54410007 is depicted in Figure 6. Two known genes overlapping with this SNP are AC012531.3 and HOXC6. Several other genes are also found in this 200-kb region. The above four variants are close to the RP11-42O15.2 and CASP3P1 genes. At the time this paper was written, CASP3P1 is classified as a pseudogene with no reported clinical associations.
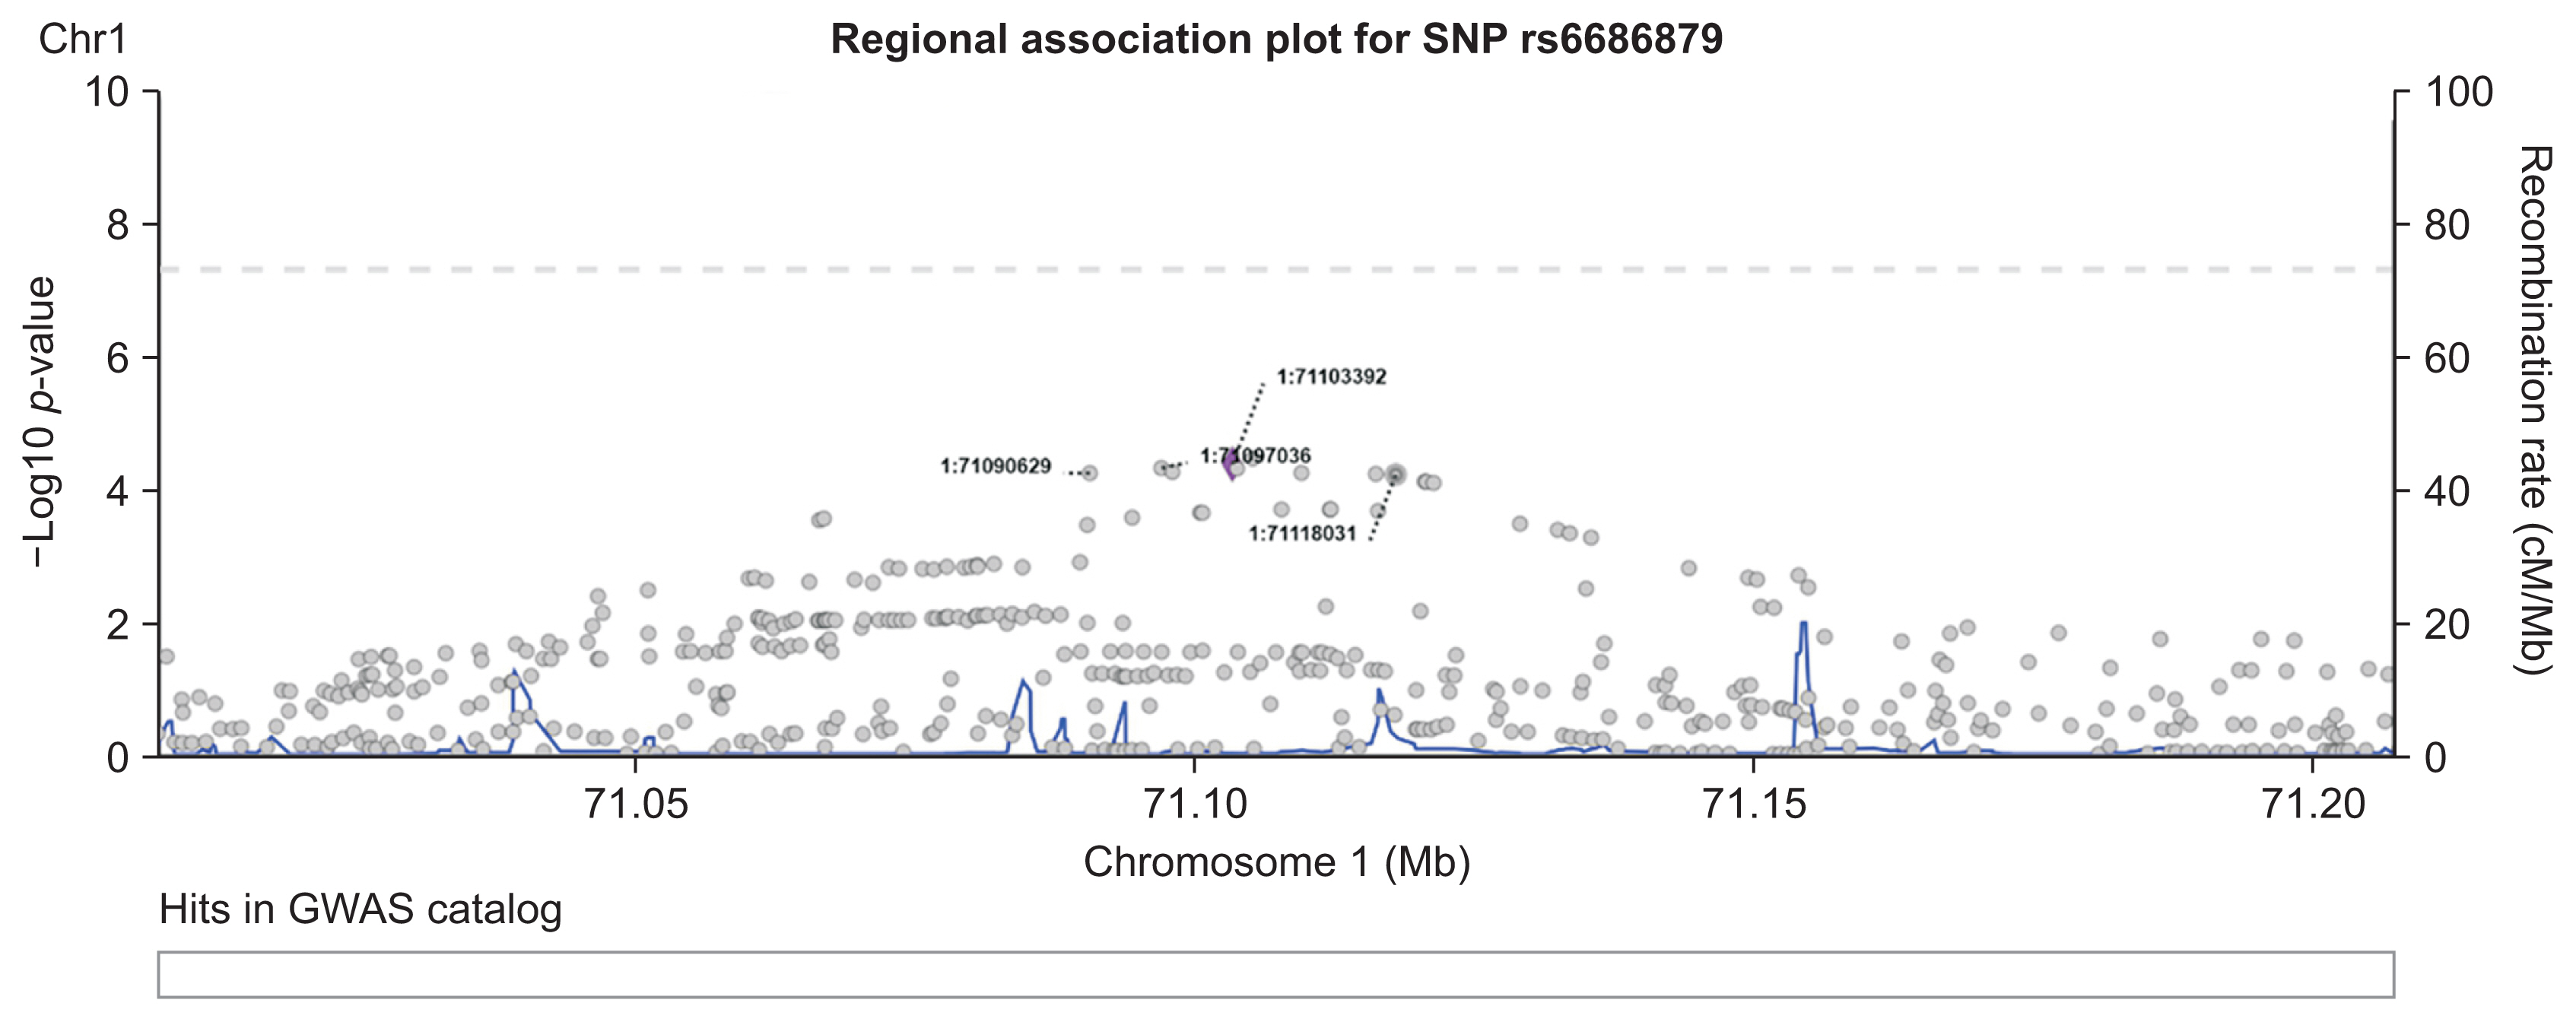
Association plot for the 100-kb region flanking rs6686879 on chromosome 1.
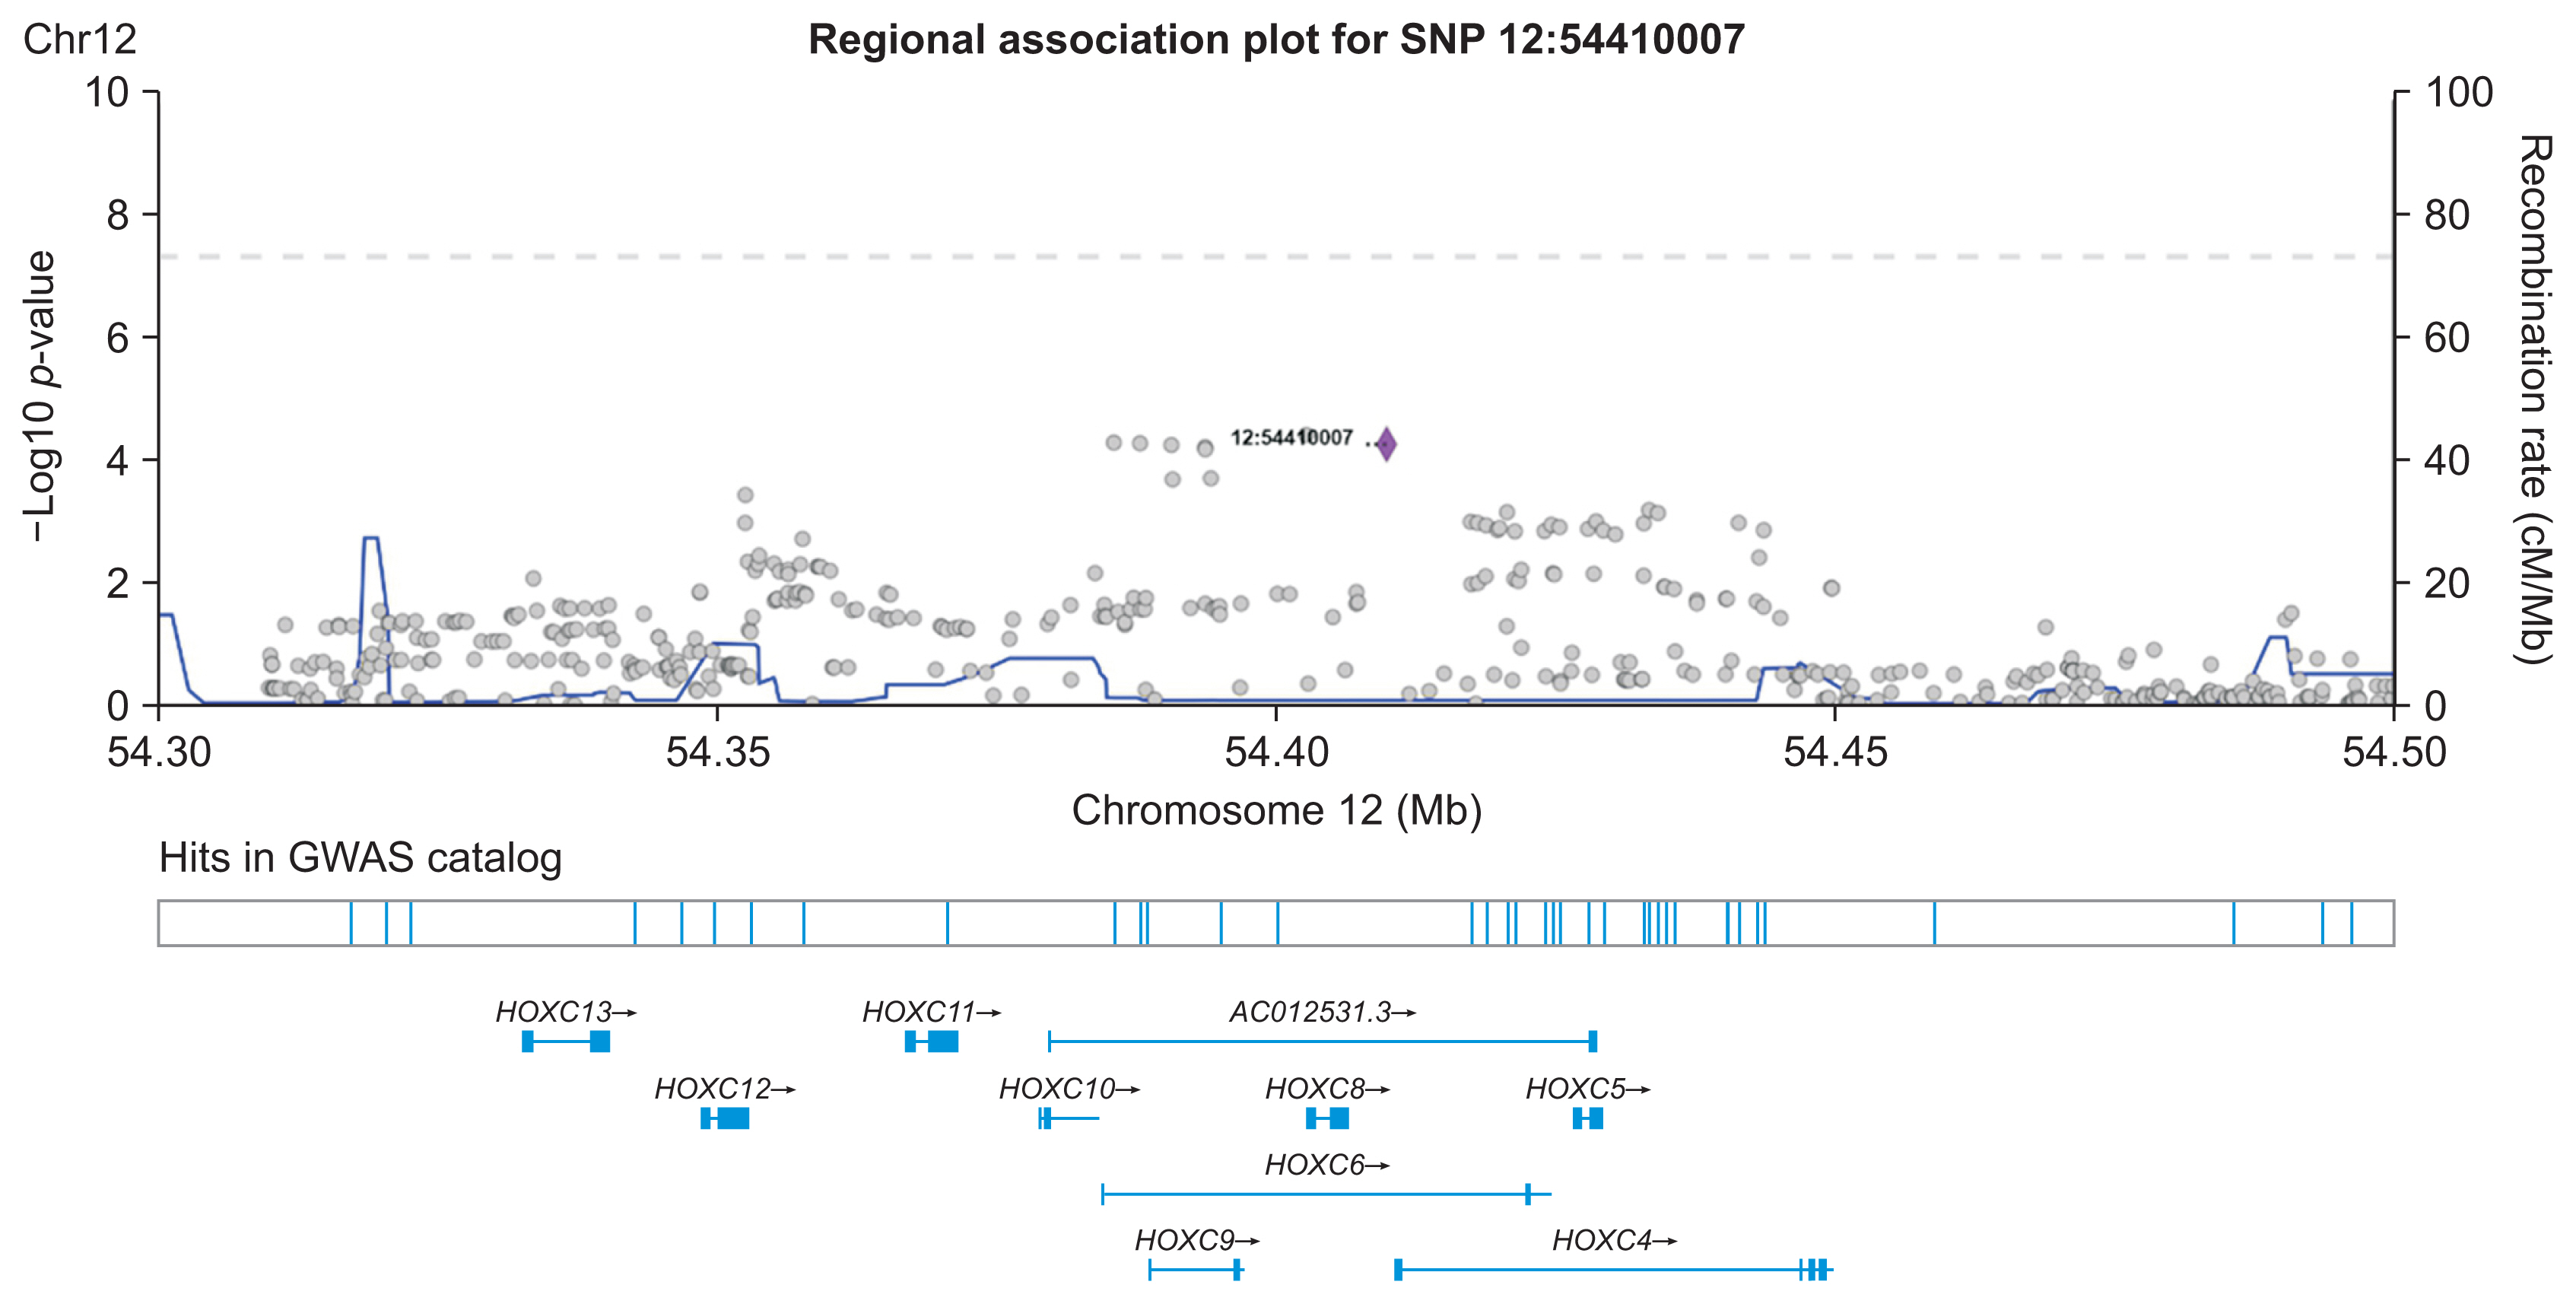
Association plot for the 100-kb region flanking 12:54410007 on chromosome 12.
Meanwhile, the 12:54410007 variant is an insertion variant that belongs to the HOXC6 gene, as depicted in Figure 6. HOXC6 is part of the homeobox family and is classified as a protein-coding gene. This gene plays an important role in the morphogenesis of all multicellular organisms. In a recent study, HOXC6 was found to be excessively expressed in colorectal cancer tissues; that study also indicated that higher HOXC6 expression was associated with poorer overall survival [26]. HOXC6 has been included in several prognostic risk models as a signature gene [27]. Qi et al. [28] utilized public RNA and mRNA sequencing data from The Cancer Genome Atlas database to analyze the expression of HOXC6 in colorectal cancer in relation to the tumor immune microenvironment (TIME). They performed differential expression analysis to find that upregulated and over-expressed HOXC6 had a strong impact on a poor prognosis in colorectal cancer. Moreover, pathway analysis (gene set enrichment analysis, Kyoto Encyclopedia of Genes and Genomes, and Gene Ontology) revealed that the upregulated genes in the colorectal cancer group with high HOXC6 expression were enriched in various inflammation-related pathways. Their results also demonstrated that TME characteristics such as chemokine expression, the infiltration ratio of immune cells, and the tumor mutation burden score, were positively correlated with high HOXC6 expression. The above study by Qi et al. [28] therefore suggests the potential causal role of HOXC6 in promoting colorectal cancer progression.
Despite the absence of connections between variants on chromosome 1, the variant on chromosome 12 became the center of the network and had strong connections with the four variants on chromosome 1. This may suggest that the variant on chromosome 12 had a significant impact on boosting the repercussions of the other four variants on chromosome 1.
To verify the significance of these SNPs, a polygenic risk score was created based on these five SNPs. The polygenic risk score model was then used to calculate the colorectal cancer risk of individuals from the case and control groups. The risk score distribution among cases and controls is shown in the form of a boxplot in Figure 7A. Despite some outliers, the boxplot shows a clear difference in the risk score between the case and control groups, and the t-test yielded a significant p-value of 0.000138.

Boxplots of the colorectal cancer risk score. (A) Network analysis risk score case and control groups (p-value threshold: 1 × 10⁻⁵). (B) Single-nucleotide polymorphisms (SNPs) with 5 lowest p-value risk score case and control groups.
As a comparable measure, we used the polygenic risk score model based on the five SNPs with the lowest p-value from the previous GWAS [10]. These SNPs were rs58207296, rs6863320, rs1892764, rs4734950, and 8:108161966, all of which are intergenic variants. The polygenic risk score model based on these five SNPs was then applied to both groups. The risk distribution is shown in Figure 7B. The ttest between the case and control groups based on these five SNPs with the lowest p-values showed a significant difference between the groups. However, the p-value (0.014) was much higher than that obtained using our newly proposed method.
Based on the experimental results of the present study, our proposed model provides new insights into interactions between SNPs. We found that one locus on chromosome 12 (12:54410007) may have a significant impact on boosting the repercussions of the other 4 variants on chromosome 1 (rs10047125, rs6686879, rs11209657, and rs1192280121). Given the scarcity of variant 12:54410007 in the clinical literature, our findings may stimulate new interest in this variant since its interactions with the other four specific SNPs are suspected to be related to the promotion of colorectal cancer risk based on our results. Hence, further investigations into the biomolecular mechanisms and clinical significance of this insertion variant would be warranted to elucidate its potential role in colorectal cancer. Meanwhile, the multiple relationships of 12:54410007 with other variants can be formalized mathematically with the concept of network centrality to understand the role of the “central” variant that is involved in variants that promote colorectal cancer progression. This approach has been sought in several epistasis studies in colorectal cancer [29] and even bipolar disorder [30] and can be adapted in our pipeline if a larger and more complex network of SNPs is created. In addition, the relevance of our obtained SNPs was further shown by the fact that we obtained a higher level of significance in the polygenic risk score model based on these five SNPs than was obtained using the polygenic risk score model based on SNPs with the lowest p-values from the previous GWAS.
Our results demonstrate the capability of our proposed network analysis-based pipeline to provide complementary post-GWAS analysis to obtain a measure of how SNP-SNP interactions contribute to the risk of colorectal cancer progression. However, we need to corroborate the interactions between the variants identified in our study in different populations to avoid sampling bias. Therefore, we aim to validate our method using significant markers of colorectal cancer taken from large-scale GWAS datasets from public databases (e.g., GWAS Catalog, GWAS Central) or the dataset from the Genetics and Epidemiology of Colorectal Cancer Consortium to determine whether we can replicate the above set of SNPs identified in our results, especially variant 12:54410007, in well-established populations for GWAS of colorectal cancer, including European and East Asian populations. Our method provides a promising approach since variants not found to have significant associations with certain traits in another study or another population may emerge as significant markers in a separate study/population when they are paired with other variants based on statistical significance to build a unique network of SNPs. In addition, we also emphasize the versatility of our proposed network analysis pipeline for GWAS of various targeted traits and diseases, since the input for our approach only requires significant variants identified in GWAS. Hence, we expect to expand our proposed methodology to be used on GWAS-identified variants of different cancers/diseases in future research.
Acknowledgments
Indonesian Colorectal Cancer Consortium (IC3) provides the necessary dataset for this study.
Notes
Conflict of Interest
No potential conflict of interest relevant to this article was reported.