Machine Learning Smart System for Parkinson Disease Classification Using the Voice as a Biomarker
Article information

Abstract
Objectives
This study presents PD Predict, a machine learning system for Parkinson disease classification using voice as a biomarker.
Methods
We first created an original set of recordings from the mPower study, and then extracted several audio features, such as mel-frequency cepstral coefficient (MFCC) components and other classical speech features, using a windowing procedure. The generated dataset was then divided into training and holdout sets. The training set was used to train two machine learning pipelines, and their performance was estimated using a nested subject-wise cross-validation approach. The holdout set was used to assess the generalizability of the pipelines for unseen data. The final pipelines were implemented in PD Predict and accessed through a prediction endpoint developed using the Django REST Framework. PD Predict is a two-component system: a desktop application that records audio recordings, extracts audio features, and makes predictions; and a server-side web application that implements the machine learning pipelines and processes incoming requests with the extracted audio features to make predictions. Our system is deployed and accessible via the following link: https://pdpredict.herokuapp.com/.
Results
Both machine learning pipelines showed moderate performance, between 65% and 75% using the nested subject-wise cross-validation approach. Furthermore, they generalized well to unseen data and they did not overfit the training set.
Conclusions
The architecture of PD Predict is clear, and the performance of the implemented machine learning pipelines is promising and confirms the usability of smartphone microphones for capturing digital biomarkers of disease.
I. Introduction
Parkinson disease (PD) is a progressive neurodegenerative disorder that affects older individuals [1]. PD patients experience various motor symptoms, including bradykinesia, rigidity, and tremor, and non-motor symptoms such as memory disturbances and sleep disorder [1]. It is primarily treated by increasing dopamine levels using pharmacological therapy or surgery [2]. Research has shown that the voice is an early biomarker of this disease. The gradual deterioration of communication skills and speech impairment are common symptoms in most patients. Ho et al. [3] found that 147 of 200 PD patients showed deterioration in speech characteristics. Thus, early detection of PD is essential for disease management. Assessing the voice as a biomarker of the disease could be critical in improving PD diagnosis to prevent patients from developing unmanageable motor complications that may decrease quality of life.
The traditional PD diagnosis is primarily clinical; it is expensive and can take hours to a few days to perform. PD is usually diagnosed by a neurologist based on the patient’s medical history, a review of signs and symptoms, and a neurological and physical examination. This diagnostic process makes it difficult for patients to go to the hospital in person, especially in the mild stages of the disease. However, with advances in technology and computational capabilities, machine learning (ML) has emerged as a valuable tool for the early prediction of diseases. With high-quality data, which are usually recorded using professional equipment or wearable sensors and mobile devices, ML applications have the potential to assist doctors in the diagnostic process and clinical decision-making. Research has shown that mobile sensors embedded in smartphones, such as accelerometers, gyroscopes, and microphones, can help researchers develop valuable tools by effectively detecting digital biomarkers of diseases [4].
While most studies have focused only on research [5–10], we focused on both research and development. To this end, we present PD Predict: an intelligent system capable of predicting PD using ML and voice as a biomarker. PD Predict consists of two main components: a client-side desktop application that records audio data, extracts audio features, and makes predictions; and a server-side web application that implements ML models and predicts PD using the extracted audio features. In this paper, we first describe the creation of our original dataset from smartphone recordings drawn from the mPower database [11]. Next, we describe in detail the creation of the ML pipelines, and finally, we present the architecture of our proposed system. This paper is organized as follows: Section II describes our methodology in detail, Section III presents the results, and Section IV discusses the findings.
II. Methods
1. Dataset Creation
1) Data acquisition
This study’s database is based on the mPower Parkinson study database obtained from the mPower Public Research Portal [11,12]. mPower is a Parkinson’s disease clinical study performed only through a mobile application interface that consists of seven tasks that each participant must complete, three survey questionnaires (a demographic survey, the Unified-Parkinson’s Disease Rating Scale survey, and the Parkinson’s Disease-Questionnaire-8), and four activities (the memory task, the tapping task, the voice task, and the walking task). In this study, we were only interested in two tasks (the voice activity task and the demographic survey). Our original dataset was created in three stages: acquiring raw audio recordings, selecting valid participants, and finally extracting audio features. Python and SQL were used with the Synapse client to collect the voice recordings [13]. The demographic survey was then used to differentiate between participants with Parkinson’s disease (PWPs) and healthy controls (HCs).
2) Participant selection
Phase 1: Participant selection using the demographic survey
Participants were categorized as PWPs if they were diagnosed professionally by a physician, with a valid age and date of diagnosis. It was specified that they were parkinsonians (not caregivers) and had never undergone surgery or deep brain stimulation. Participants who were not formally diagnosed by a physician, had a valid age and a valid date of diagnosis, and had no movement symptoms were considered HCs.
Phase 2: Participant selection using the recordings’ medication-associated time points
Participants were requested to record their voice three times a day in the voice activity task, saying “Aaah” for 10 seconds at a steady pace using the smartphone’s microphone. HCs could record their voice whenever they wanted. In contrast, PWPs were requested to record their voice if they took PD medication at three specific times: before taking PD medication, after taking PD medication, and at another time. Otherwise, they were allowed to record their voices three times a day, whenever they wanted. In this phase, we only selected the recordings of participants who did not take PD medication or who recorded their voices before taking PD medication. Each participant had a unique health-code identifier, which was used in the next phase.
Phase 3: Participant selection to perform an equal case-control study
To maximize efficiency in this case-control study, we evenly distributed the participants between the two groups (PWPs and HCs). In the original database, some participants recorded their voice many times, while others recorded their voice only once. In this step we selected only two recordings from each participant, that recorded their voice more than once. Next, we examined each recording to verify that we selected valid recordings with minimal background noise. We also matched the groups’ participants by age and sex. We specifically selected participants who were 40 years of age and older, as PD predominantly affects older individuals [14]. The final cohort chosen is described in Table 1.
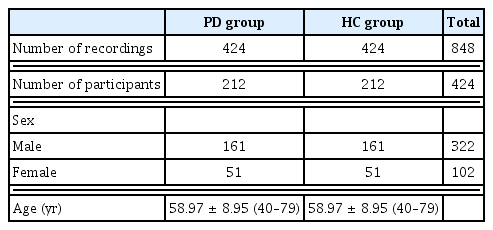
Final distribution of valid subjects in this study
3) Audio feature extraction
Feature extraction is critical in ML and pattern recognition systems [15], mainly when dealing with audio data. Because audio signals are non-stationary, feature extraction is performed on a frame basis by dividing the signals into short frames [16]. All the recordings were divided into 25-ms windows with a 10-ms step size (usually between 20 and 40 ms [16]) and sampled at 44.1 kHz. Using the Surfboard [17] library, we extracted 123 audio features. This Python library is built with state-of-the-art audio analysis packages and provides an easy-to-use API to extract several audio features applicable in the medical domain. Surfboard allows the calculation of important audio feature statistics to obtain a feature-rich dataset. Table 2 summarizes the extracted features and showcases the structure of our final dataset.

Extracted features and structure of the dataset
4) Dataset partitioning
Before starting the modeling phase, we divided the dataset into two sets: a training set and a holdout set. The training set was used to train the pipelines and evaluate their performance using subject-wise cross-validation (CV), while the holdout set was used to verify the models’ generalizability on unseen data. For data partitioning and using the subject-wise division approach [18], we allocated 80% of the dataset to the training set and 20% to the holdout set. This division guarantees that the subjects (or participants) and their relative recordings in the training set are independent of the subjects and their relative recordings in the holdout set. Table 3 details the distribution of participants in both sets.
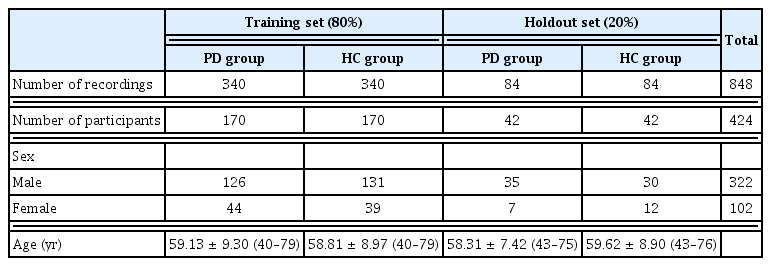
Distribution of participants in the training and holdout sets
2. Classification Pipelines
1) Data preprocessing
In this step, we applied two forms of preprocessing [19] to the dataset: data imputation and data scaling. Data imputation replaces missing values in a feature vector with the mean, the median, or the most frequent value of the same feature vector; this step is required because missing values can cause problems for ML algorithms. Data scaling standardizes the dataset, as it contains various features with varying scales. This step ensures that all features contribute equally to the learning process. Table 4 presents more details.
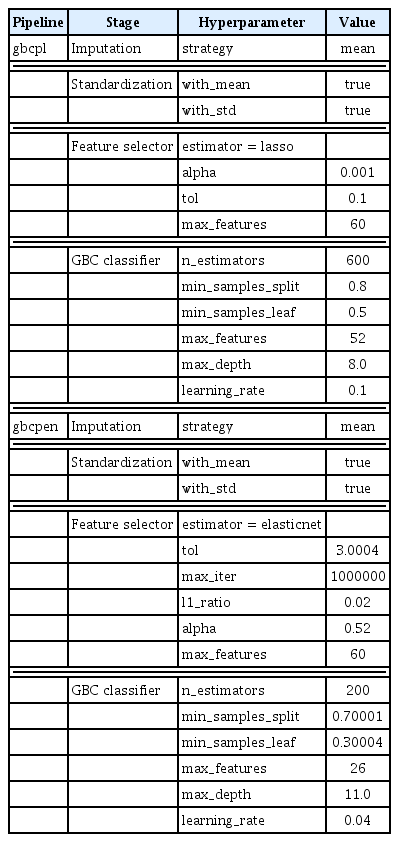
Hyperparameters of the two pipelines
2) Feature selection
Feature selection is an essential concept in ML. Having a proper subset of features reduces the complexity of a model, enables it to be trained faster, and makes it easier to interpret. Researchers use various feature selection techniques [20], such as filter, wrapper, and embedded methods. In this work, we used two embedded methods. The best subset of features was selected using a meta-transformer based on feature importance, with Lasso or ElasticNet [21] as the primary estimator.
3) Machine learning pipelines
To develop our models, we used pipelines. A pipeline automates an ML workflow by dividing it into reusable independent modular parts: in our case, data imputation, data scaling, feature selection, and then classification. In this study, we created two pipelines: a gradient boosting classifier (GBC) pipeline with Lasso (gbcpl) and a GBC pipeline with ElasticNet (gbcpen); their hyperparameters were tuned using the randomized search technique [22] (Table 3). To correctly estimate the performance of the pipelines, we used a nested CV approach, where two subject-wise CV techniques were grouped to form two loops, an inner loop and an outer loop, as shown in Figure 1. In the outer loop, we used the stratified-group k-fold CV technique with k = 10. In each loop, the training set is divided into 10 parts or folds; nine parts are used to train the pipelines, and the remaining part is used for validation. The inner loop divides the nine parts into five using stratified-group k-fold CV with k = 5. Four parts are used to fit several pipelines with random hyperparameters. The remaining part is used to select the best pipeline with specific hyperparameters by maximizing a scoring metric (in our case, recall). When the best pipeline is found in the inner loop, it is used by the outer loop to estimate its performance on the validation set. This step is repeated 10 times, and the performance of the pipelines is reported as the mean (standard deviation) for each performance metric. This technique is time-consuming, considering the time needed to find optimal hyperparameters by the inner loop. However, it has been demonstrated to produce accurate results and reduces overfitting when dealing with small datasets [23]. To assess the performance of the pipelines, we calculated three performance measures: accuracy, recall, and the F1-score.

Schematic illustration of the nested cross-validation approach.
3. Implementation
As previously described, this work is divided into two parts: the dataset creation part (from data acquisition and participant filtering to audio feature extraction and data partitioning) and the pipeline creation part (data preprocessing, feature selection, and tuning the selected ML pipelines). To implement those two parts, we developed PD Predict. PD Predict is an intelligent system that classifies PD using ML and voice. It can be divided into two main components: a client-side desktop application that allows recording voice data, extracting audio features, and making predictions; and a server-side web application that implements our ML pipelines and allows user management, database indexing, and processing incoming requests with audio features to classify PD.
1) Client-side desktop application
The client-side desktop application is a Windows application developed entirely using Python and Kivy [24], an opensource, cross-platform graphical framework for natural user interface development. Our application has six screens with three main features: recording audio data, extracting audio features and communicating with the server via HTTP requests (Figures 2, 3A). Voice recording is done using PyAudio [25], which provides Python bindings for PortAudio, a cross-platform audio I/O library used to record and play audio on desktop operating systems such as Windows, Linux, and macOS. Each recorded file is sampled at 44.1 kHz and saved in .wav format with a 10-second duration. Feature extraction is performed using Surfboard; we can extract audio features either from the recorded .wav file or from a test .wav file that is available on the computer (for instance, using test recordings from the holdout set). Extracted features are then sent to the server via HTTP requests in the JSON format to a prediction endpoint. This endpoint is developed using a REST API, where each HTTP request includes a header with user credentials in the form of a token that is generated for the user when successfully logged in to the server. Only authenticated users to the server can use the desktop application. An HTTP response is returned to the application in JSON format when the server successfully authorizes the user and finishes processing the request with the extracted features by a selected ML pipeline. We packaged our application into a Windows executable file using PyInstaller [26] and Inno [27] for ease of use.
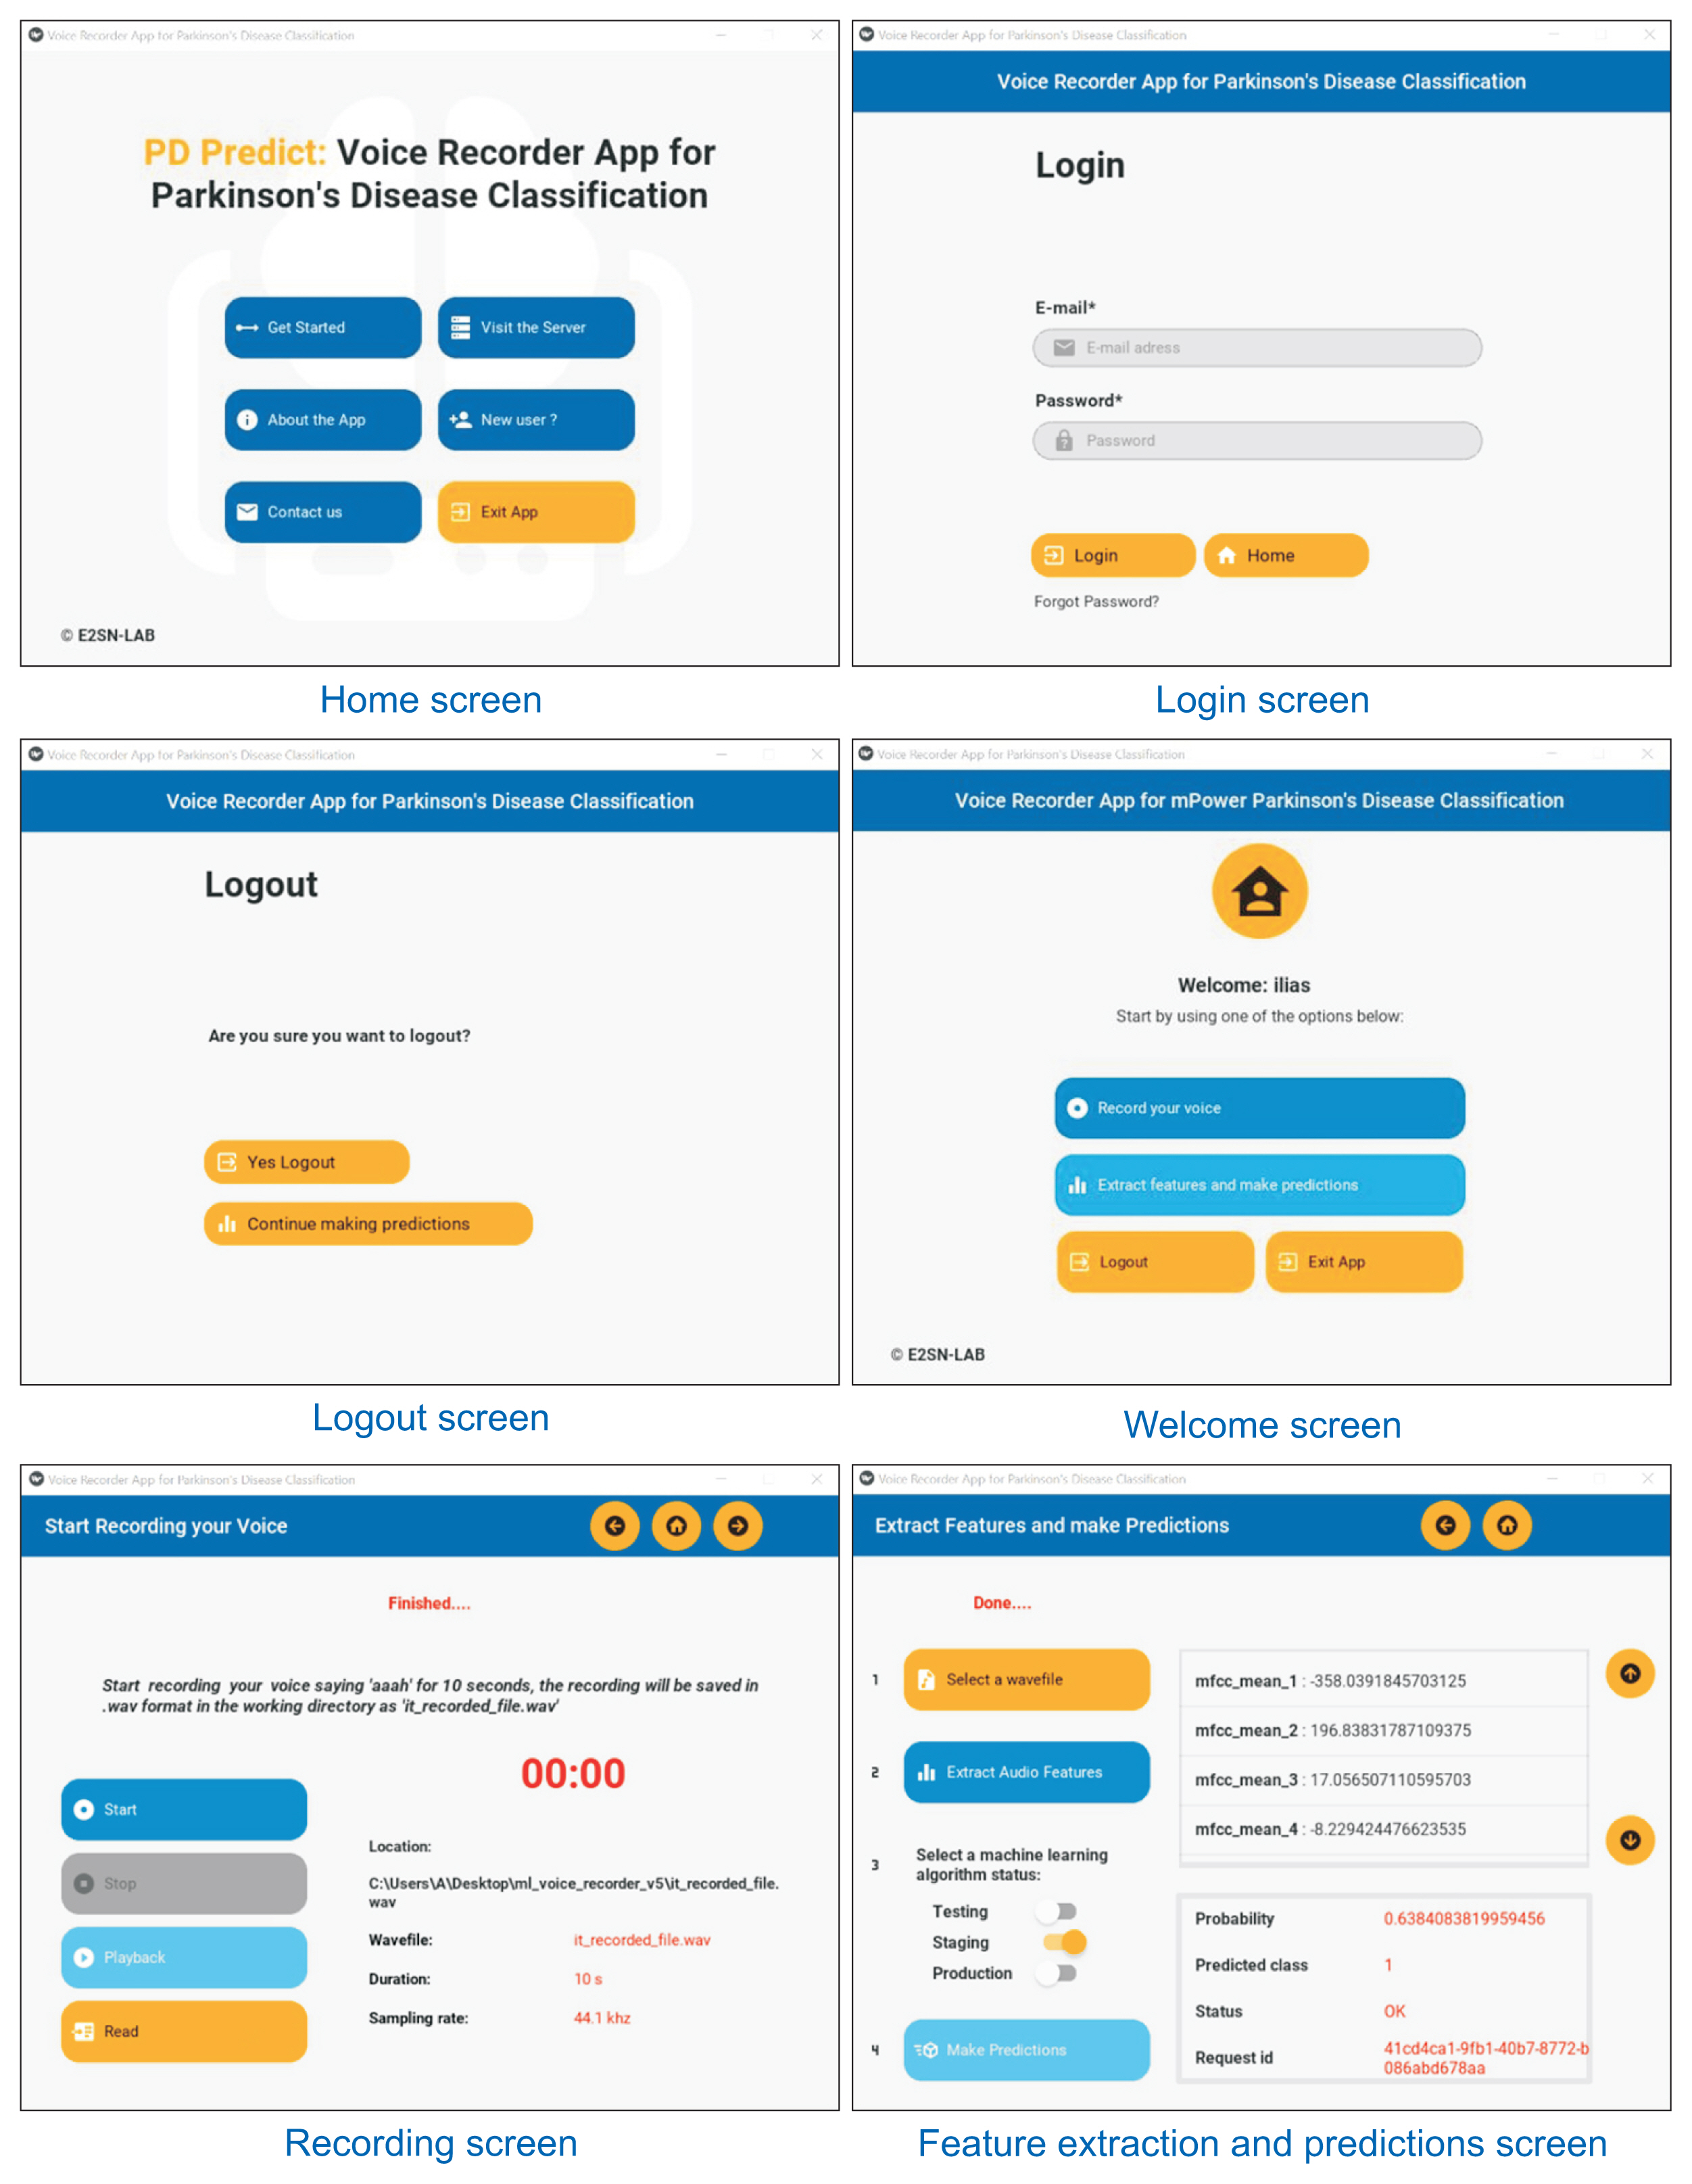
Various screens in the clientside desktop application.

Architecture of PD Predict: (A) client-side application and (B) server-side web application.
2) Server-side web application
The server-side web application is developed entirely using Django [28], an open-source, high-level Python web framework that encourages rapid development and clean, pragmatic design. The server’s database is based on PostgreSQL, an open-source relational database management system. The ML pipelines were trained using Scikit-learn [29], saved using Joblib, and accessed via a prediction endpoint developed using Django Rest Framework. When a user posts a request to the server with the extracted audio features, those features are deserialized by the REST API and stored in the database to be processed by the selected ML pipeline. When processing is done, the response of the ML pipeline is stored in the database and then serialized by the REST API in a JSON format to be used by the desktop application. The web application also provides a mechanism for user management through token authentication. Its initial design is developed using HTML, CSS, and Bootstrap and served using WhiteNoise. We used Gunicorn for deployment, a pure-Python WSGI HTTP server. The entire project was then containerized using Docker in an Ubuntu image and deployed to Heroku, a platform-as-a-service cloud provider. Our web application is accessible via the following link: https://pdpredict.herokuapp.com, and its architecture is presented in Figure 3B.
III. Results
Figures 4 and 5 present the performance of the pipelines using nested CV by varying the maximum number of features to select by the meta-transformer in each pipeline based on features importance. We conclude that a maximum of 60 features yielded the best performance in both pipelines.
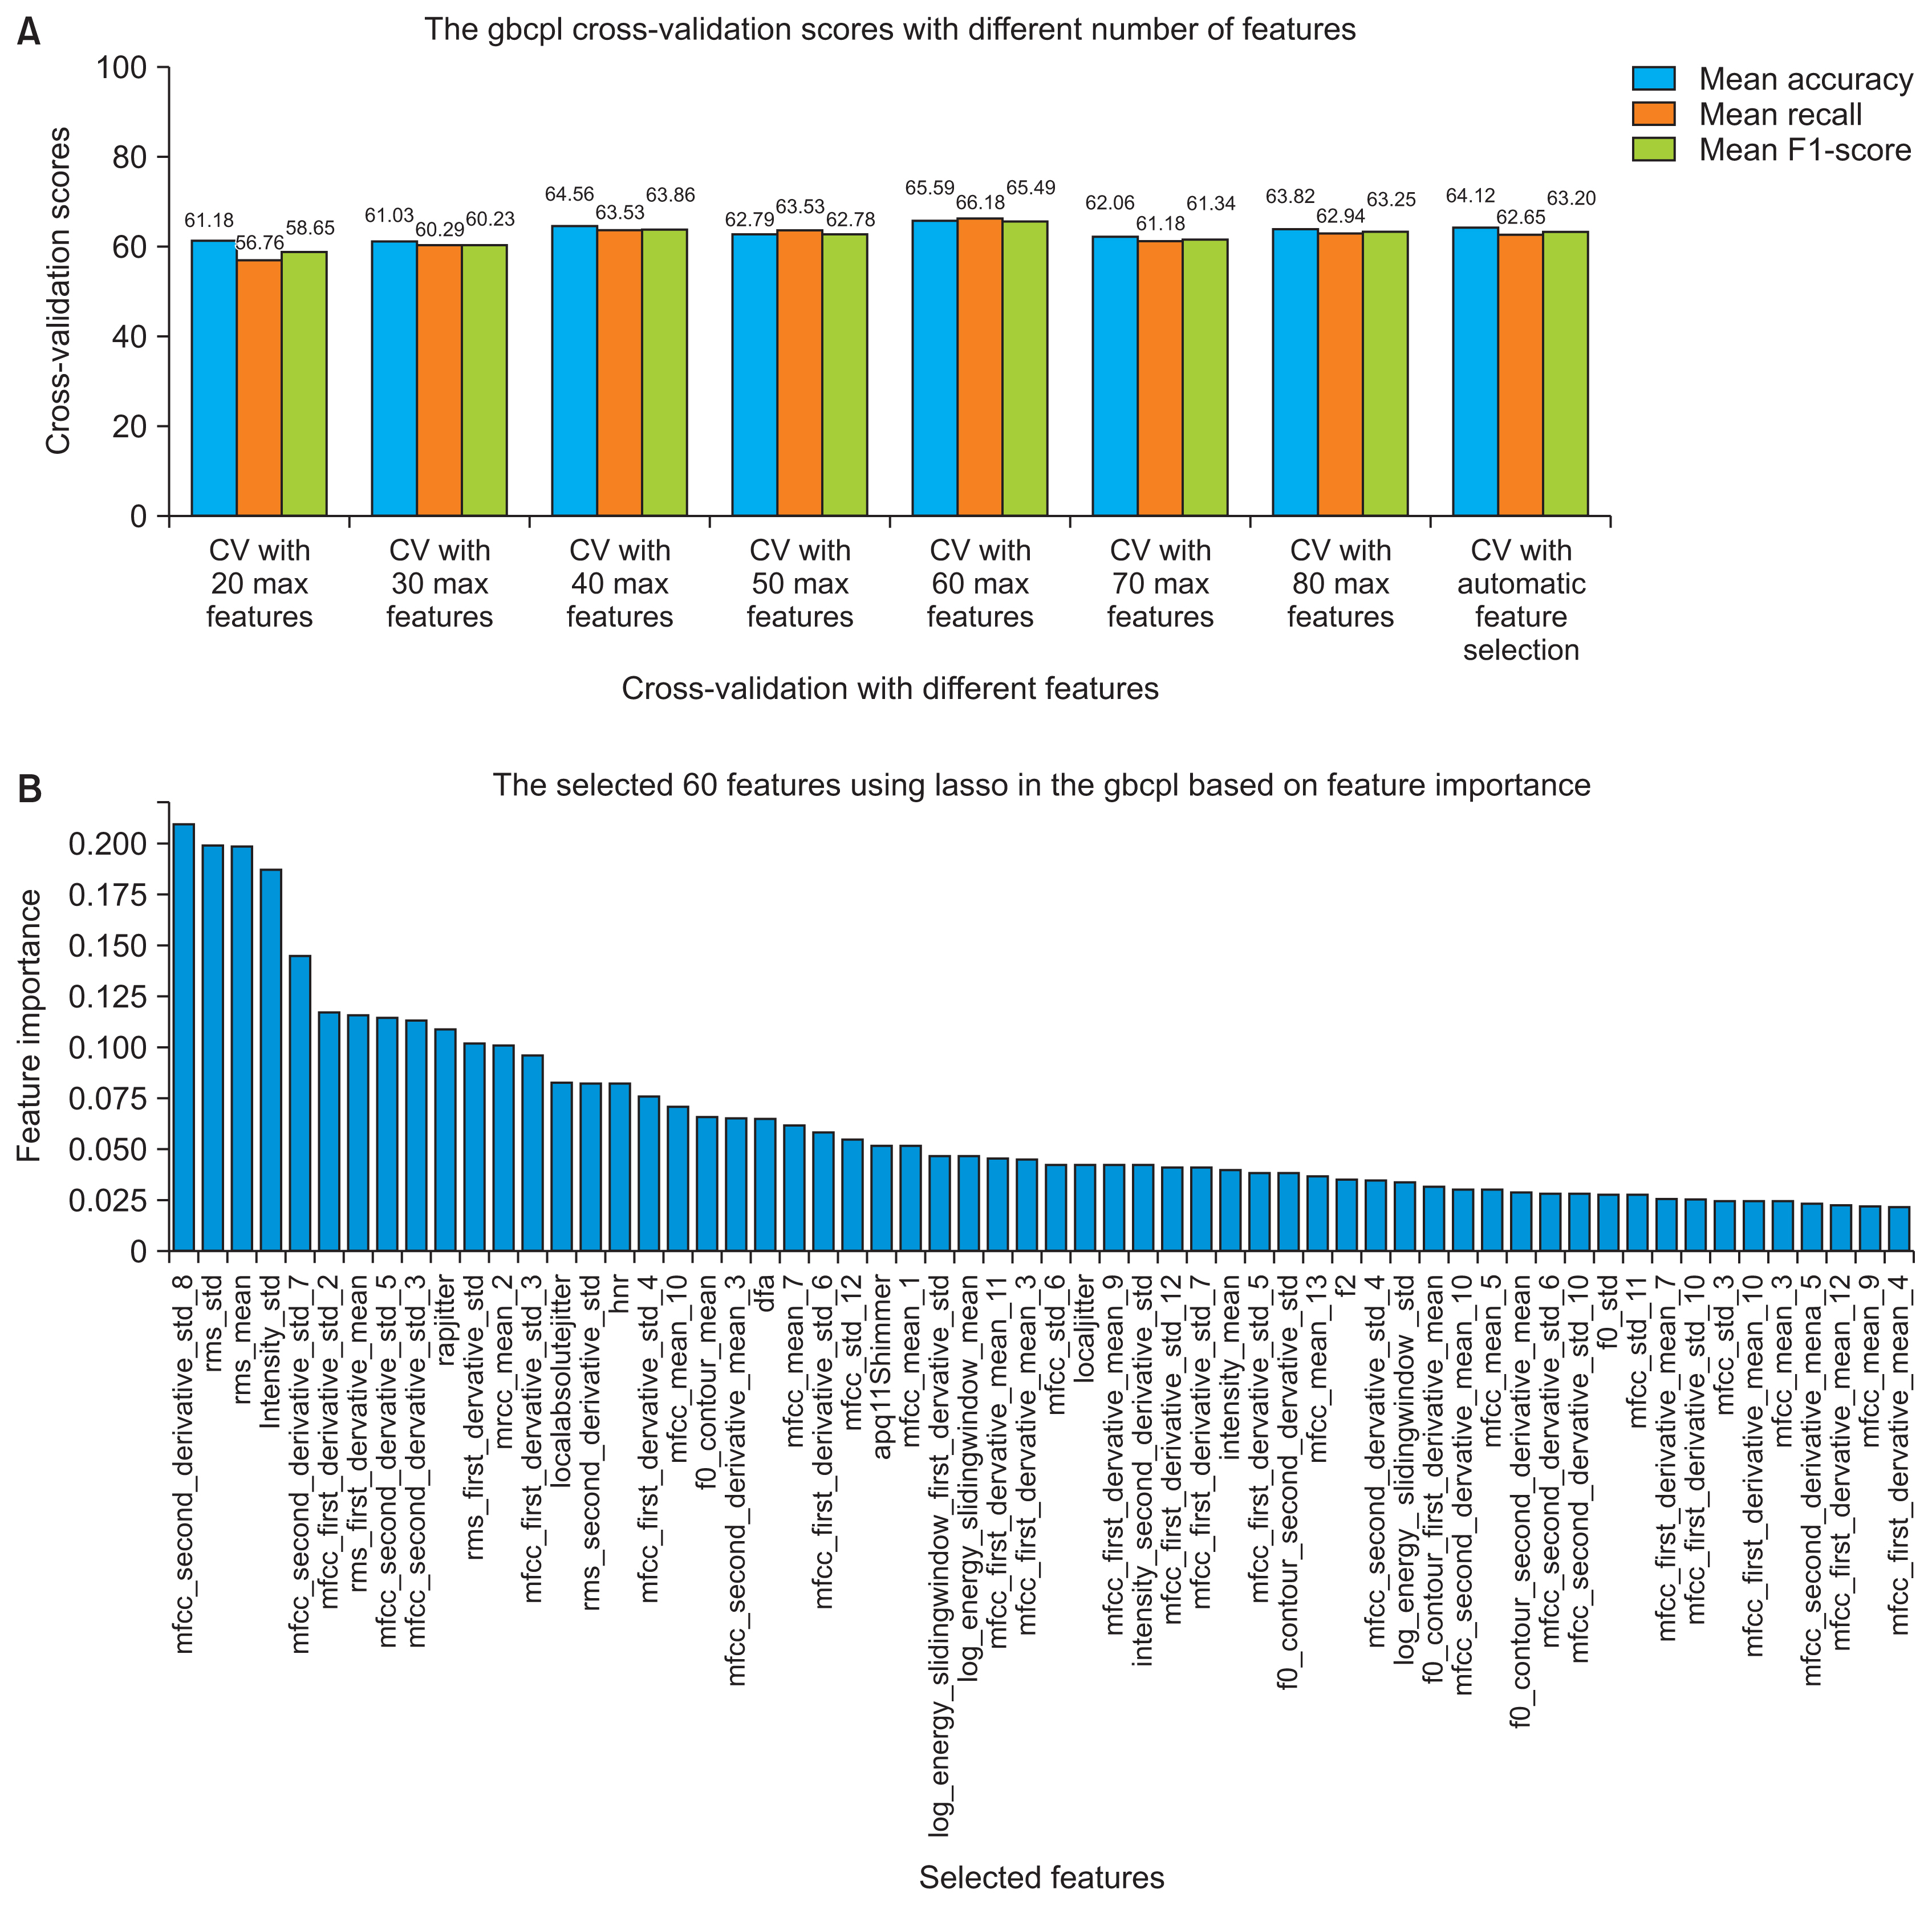
(A) The gbcpl cross-validation performance using a different subset of features and (B) the final 60 chosen features.

(A) Performance of gbcpen in cross-validation using different subsets of features and (B) the final 60 chosen features.
Table 5 presents the performance of the two pipelines using nested CV and their performance on the training and the holdout sets. From CV performance, we can conclude that gbcpl had higher accuracy, sensitivity, and F1-score than gbcpen, with slight differences of 0.65%, 1.18%, and 0.61%, respectively.
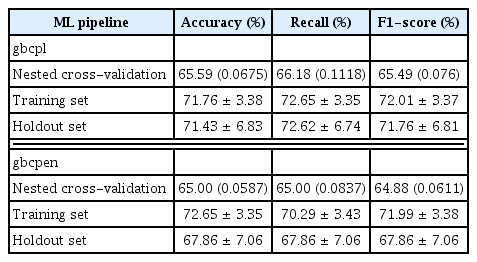
Summary of the performance of the pipelines
The performance of a model on the training set is not practically useful for model selection, but it is helpful to identify whether the model has overfitted the training set. First, two final pipelines with a set of hyperparameters were chosen, as shown in Table 4. Those pipelines were trained using the entire training set; then, we measured their performance on the same set to identify overfitting. The following results are reported with 95% confidence intervals (CIs), a range of values calculated from the data, most likely including the actual value estimated for the population. In terms of accuracy, given the sample, gbcpl had an accuracy of 71.76% (95% CI, 68.38%–75.14%). In other words, there is a 95% likelihood that the range of 68.38% to 75.14% covers its accuracy. The accuracy of gbcpen was 72.65% (95% CI, 69.3%–76%). Furthermore, the sensitivity or recall of gbcpl was 72.65% (95% CI, 69.3%–76%). where-as that of gbcpen was lower 70.29% (95% CI, 66.86%–73.72%). The F1-score showed a similar pattern.
Before deciding whether overfitting was an issue, we measured the performance of the pipelines on the holdout data, which was kept unseen during the training process. The performance with unseen data is essential for model selection to draw conclusions regarding the generalizability of a pipeline. Given the sample size, gbcpl was 71.43% (95% CI, 64.6%–78.26%) accurate, 72.62% (95% CI, 65.88%–79.36%) sensitive, and had an F1-score of 71.76% (95% CI, 64.95%–78.57%). Meanwhile, gbcpen was accurate, sensitive and had an F1-score of 67.86% (95% CI, 60.8%–74.92%). From the above, we can conclude that both pipelines generalize well to unseen data and do not overfit the training set.
Both pipelines are saved and deployed to our web server to be accessible via a REST API from a prediction endpoint, with different statuses, a staging status for the gbcpl, and a production status for the gbcpen. The pipelines selection is provided within the desktop application when making predictions.
IV. Discussion
In this study, we presented PD Predict, an ML-based system for predicting and classifying PD. Its architecture is divided into two main components: a client-side desktop application and a server-side web application. PD Predict implements all the steps described in the methodology logically, starting from voice recording to PD classification. One of the advantages of this architecture is its extendibility to other applications than PD prediction. Once the server-side web application development is complete, adding ML pipelines is quickly done in a few lines of code to be available from a prediction endpoint via the REST API. The implemented ML pipelines showed moderate performance, between 65% and 75%, which is to be expected given the quality of the recordings, as the mPower study is a clinical trial performed in uncontrolled environments where most participants recorded their voices at home, outdoors, or in crowded places. In addition, the quality of smartphone microphones is not comparable to that of the sophisticated equipment used in controlled clinical studies and performed in controlled environments. Nevertheless, the pipelines’ performance is promising and confirm the usability of smartphone microphones in capturing digital biomarkers of PD.
A client-side application can be anything from a desktop, mobile, to web application. We choose to develop a desktop application for this prototype because both smartphones and laptops’ microphones are comparable in performance, which raises the first limitation of this study. For this prototype, the desktop application is not practically useful for patients and healthcare providers, as most of them are not interested in accessing the extracted audio features, which could be easily hidden. However, we decided to keep this application for illustration purposes. The second limitation is the development of a desktop application instead of a smartphone application because, given the nature of the population, most of the patients are older individuals and may tend to use smartphones more than laptops. The third limitation of this study is the validity of the performance of the ML pipelines in a clinical trial.
Given the above, our subsequent studies will focus on solving the above-acknowledged limitations. First, we aim to develop a cross-platform smartphone application that will be available on both Android and IOS, easy to use, and addressed mainly to patients and healthcare providers. Second, we will also focus on improving the ML pipelines’ performance and the server-side web application by adding more useful features. Third, a final study will address scientific evidence and prove the usefulness of the ML pipelines in a clinical trial.
With this prototype of PD Predict, we tried to cross the bridge between research and development, as most ML models are left in papers and never used in practice.
Acknowledgements
The authors would like to thank every participant who contributed as a user of the Parkinson mPower mobile application and as part of the mPower study [11,12] developed by Sage Bionetworks and described in Synapse (https://doi.org/10.7303/syn4993293).
Notes
Conflict of Interest
No potential conflict of interest relevant to this article was reported.