Monitoring Mental Healthcare Services Using Business Analytics
Article information
Abstract
Objectives
Monitoring healthcare activities is the first step for health stakeholders and health professionals to improve the quality and performance of healthcare services. However, monitoring remains a challenge for healthcare facilities, especially in developing countries. Fortunately, advances in business analytics address this need. This paper aims to describe the experience of a low-income healthcare facility in a developing country in using business analytics descriptive techniques and to discuss business analytics implementation challenges and opportunities in such an environment.
Methods
Business analytics descriptive techniques were applied on 3 years’ electronic medical records of outpatient consultation of the University Psychiatric Centre (CPU) of Casablanca. Statistical analysis was conducted to compare results over years.
Results
Over the 3 monitored years, the monthly number of computerized physician order entries increased significantly (p < 0.001). Physicians improved their personal recording over years. Schizophrenia as well as depressive and bipolar disorders were noted at the top of outpatient mental disorders. Antipsychotics are the most prescribed drugs, and a significant annual decrease in outpatient care wait time was noted (p < 0.001).
Conclusions
Business analytics allowed CPU to monitor mental healthcare outpatient activity and to adopt its business processes according to outcomes. However, challenges mainly in the organizational dimension of the decision-making process and the definition of strategic key metrics, data structuration, and the quality of data entry had to be considered for the optimal use of business analytics.
I. Introduction
The decision-making process is fundamental for healthcare facilities struggling to improve healthcare quality. Monitoring activities is the first step in the decision-making process, yet it remains a challenge for healthcare facilities, requiring maturity of their decision information system where information is collected correctly, shared in a timely manner in a representative form, and personally adapted to health professionals’ needs.
As an emerging data science field to leverage data and to translate it into actionable insights, business analytics (BA) empowers decision makers with data and supports them to make decisions. BA may be defined as “a broad category of applications, technologies, and processes for gathering, storing, accessing, and analyzing data to help business users make better decisions” [1].
Three types of BA are employed by organizations: descriptive, predictive, and prescriptive [2,3]. Most healthcare facilities start with descriptive analytics, using data to understand past and current healthcare decisions and to make informed decisions [4]. Studies of applied descriptive analytics for chronic diseases [5], cardiovascular diseases [6], diabetes, oncology, elderly care, gynecology, mental health [7], supply chain management, and clinical research have shown that it can enable the delivery of timely care and cost-saving by eliminating inefficiencies.
The majority of BA users are in developed countries; therefore, there is a need for promotion of research on BA in developing countries [8].
This study aimed to describe the experience of a low-income healthcare facility in adopting BA where business processes were adjusted according to BA insights and to discuss implementation challenges in such an environment.
II. Case Description
1. Project Settings
The University Psychiatric Centre Ibn Rochd (CPU) is the reference public teaching hospital for mental health in the Greater Casablanca region of Morocco with an estimated population of 6.812 million citizens in 2014 and a litter capacity of 104 beds.
CPU has utilizes an Electronic Medical Record (EMR) system in outpatient consultation, which it adopted in 2015. Each time a patient has a consultation, the doctor adds clinical notes to the patient record in the EMR system and a single computerized physician order entry (CPOE) of psychiatric drug prescription. However, not all patient visits are recorded in the EMR system. The ratio of patients seen with and without CPOE was 0.48 (2,200/4,560) in 2016, 2.33 (5,496/2,358) in 2017, and 1.27 (4,540/3,568) in 2018.
To monitor this activity, we applied BA techniques to EMR data over a 3-year period from Jan 19, 2016 to Dec 31, 2018. The monitored key metrics were the following: (1) monthly number of consultation represented by the monthly number of CPOEs; (2) number and proportion of mental diseases represented by the 10th revision of the International Classification of Diseases (ICD10); (3) number of prescribed psychiatric drugs aggregated by family and specialty names; (4) monthly number of CPOEs performed by a particular physician; (5) number of CPOEs for a particular geolocation using patient district geolocation; and (6) monthly averaged outpatient care wait time computed by calculating for each patient the delay between patient arrival time and CPOE time.
2. Business Analytics Techniques
Descriptive business analytics was conducted including three steps.
1) Data extraction
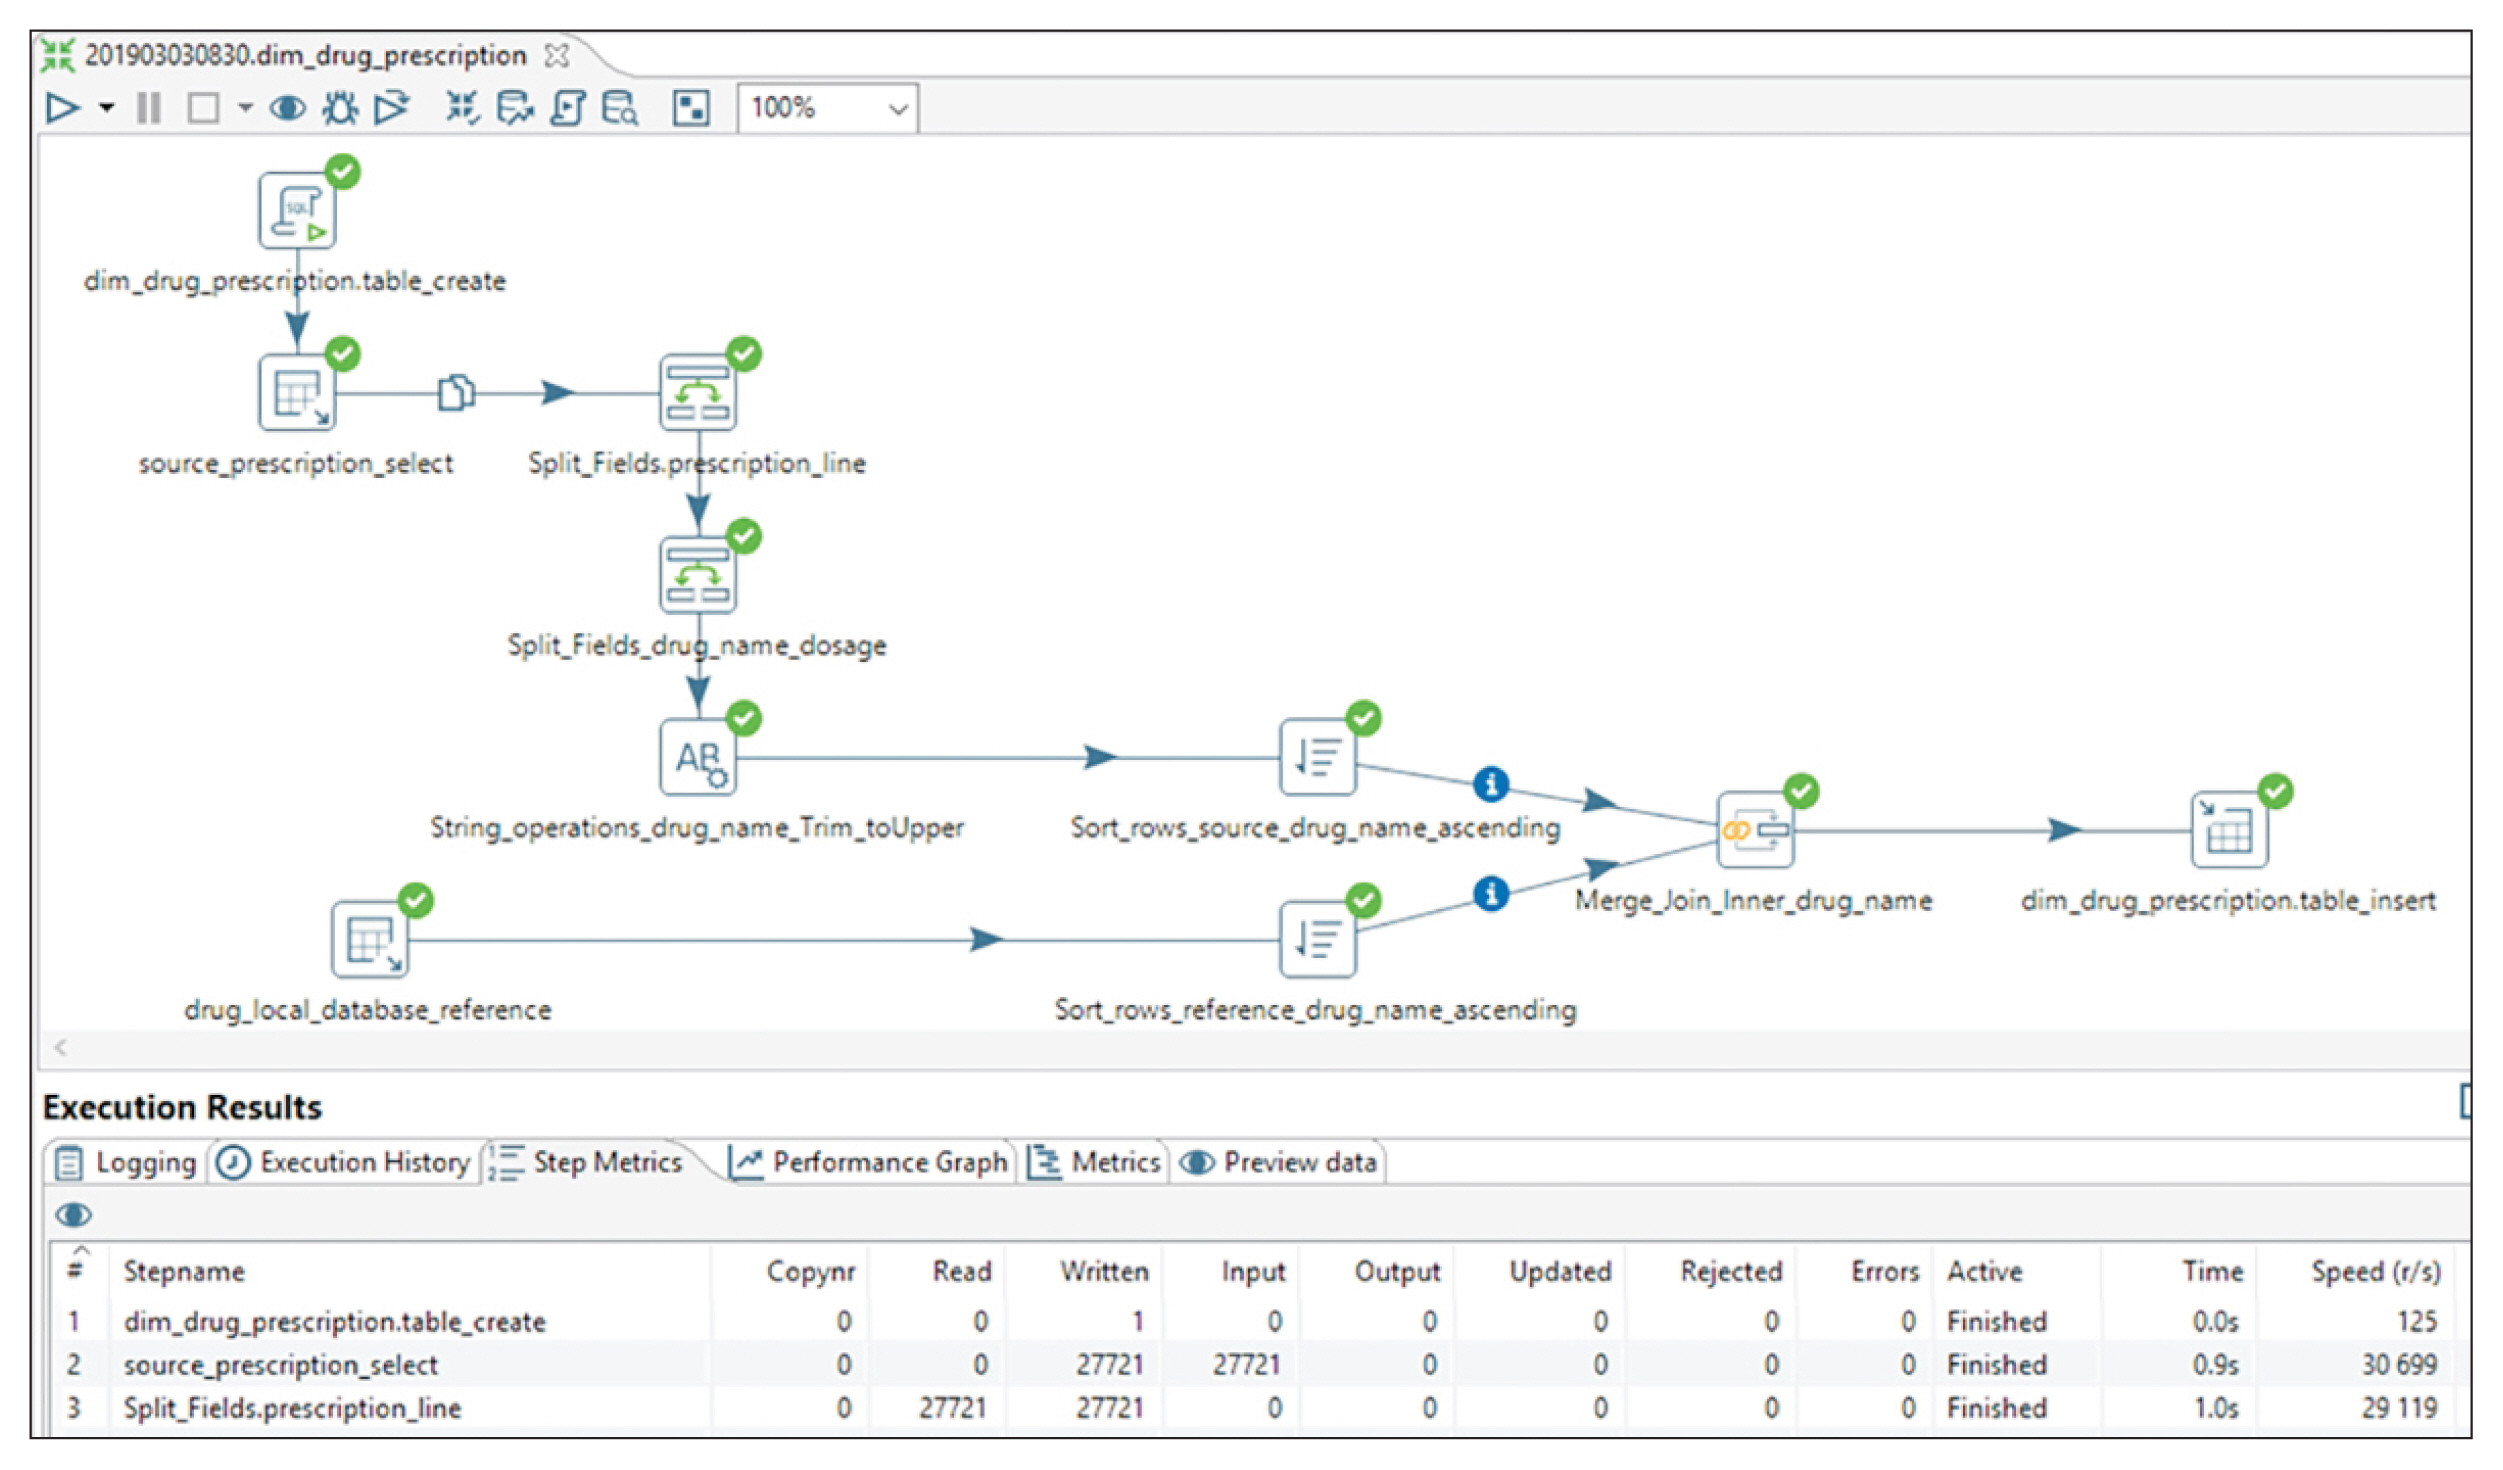
It includes three processes namely extraction, transformation, and load (ETL) to extract EMR data fields using structured query language queries, to compute new fields, and to store fields in a data warehousing server. We used Pentaho Data Integration as an ETL graphical tool [9]. Figure 1 shows a drug dimension transformation.
3. Statistical Analysis
Using R statistics version 3.5.3, we describe continuous variables by mean ± standard deviation, and categorical variables by number (%). We applied the Student t-test to compare CPOE means of 2 years and ANOVA one-way test to compare multiple outpatient wait care time annual means. A p-value less than 0.05 was considered statistically significant.
4. Results
1) Acts quantitative assessment
CPU outpatient acts are estimated by the monthly number of CPOEs (Figure 4). This number increased significantly (p < 0.0001) in 2017 (mean ± SD, 433 ± 66) compared to 2016 (183 ± 88). However, a significant decrease was noted (p = 0.028) in 2018 (378 ± 47) compared to 2017.
2) Medico-economic key metrics
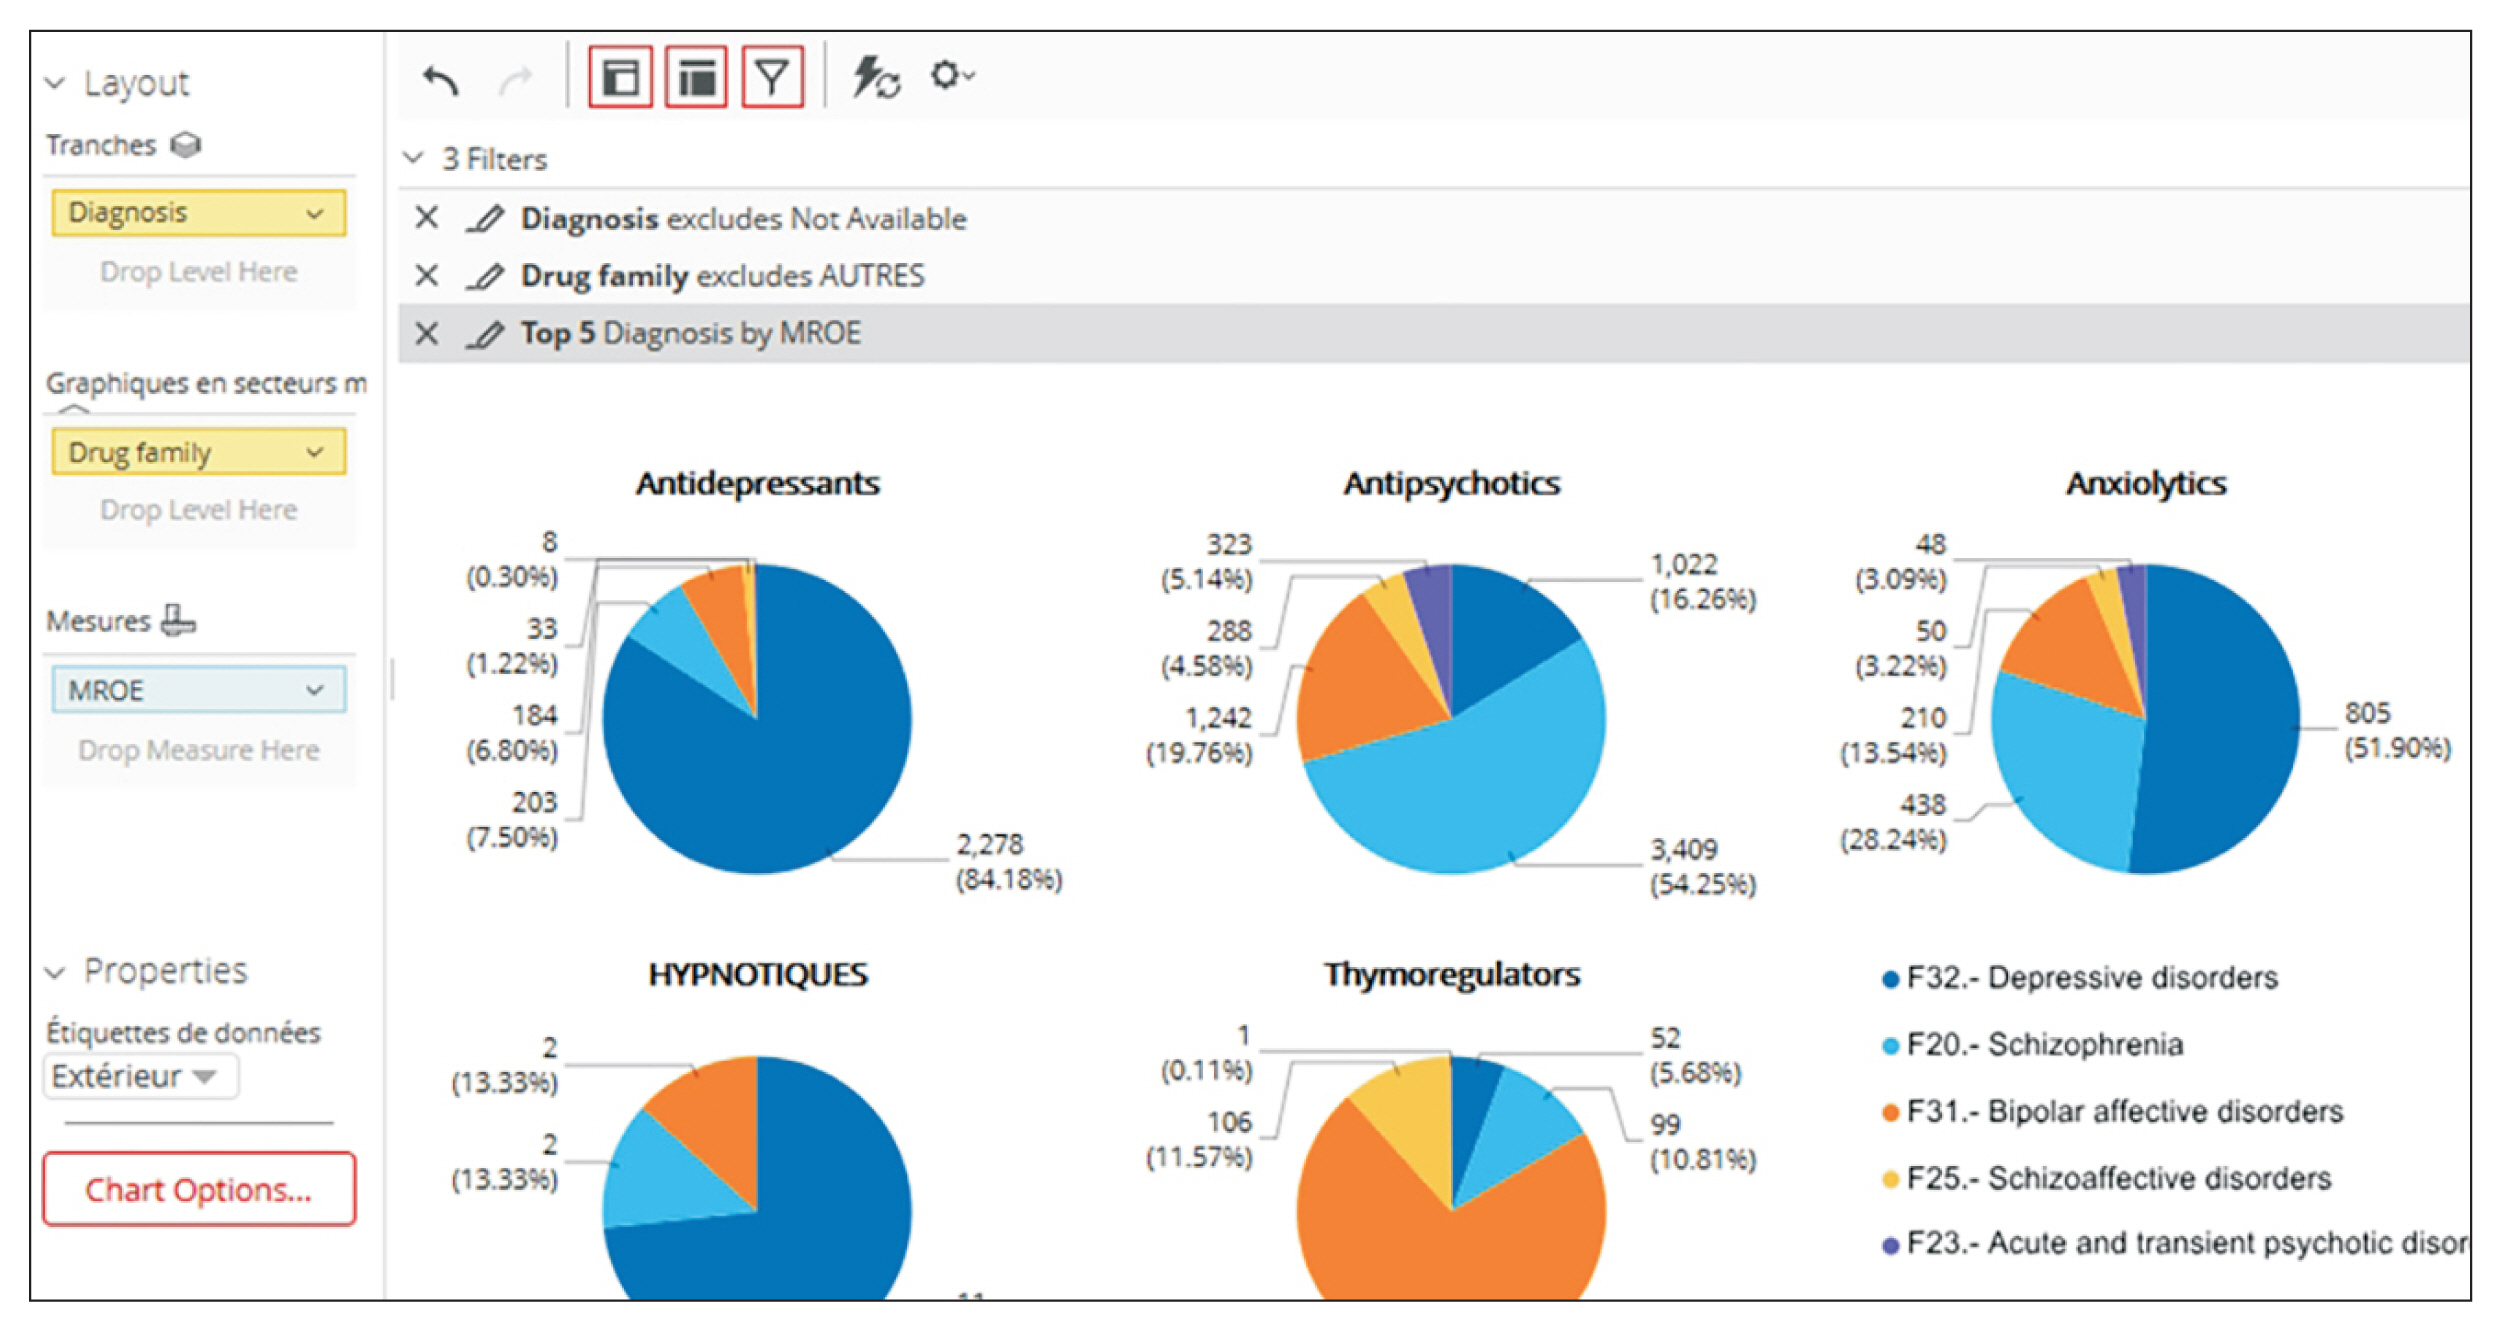
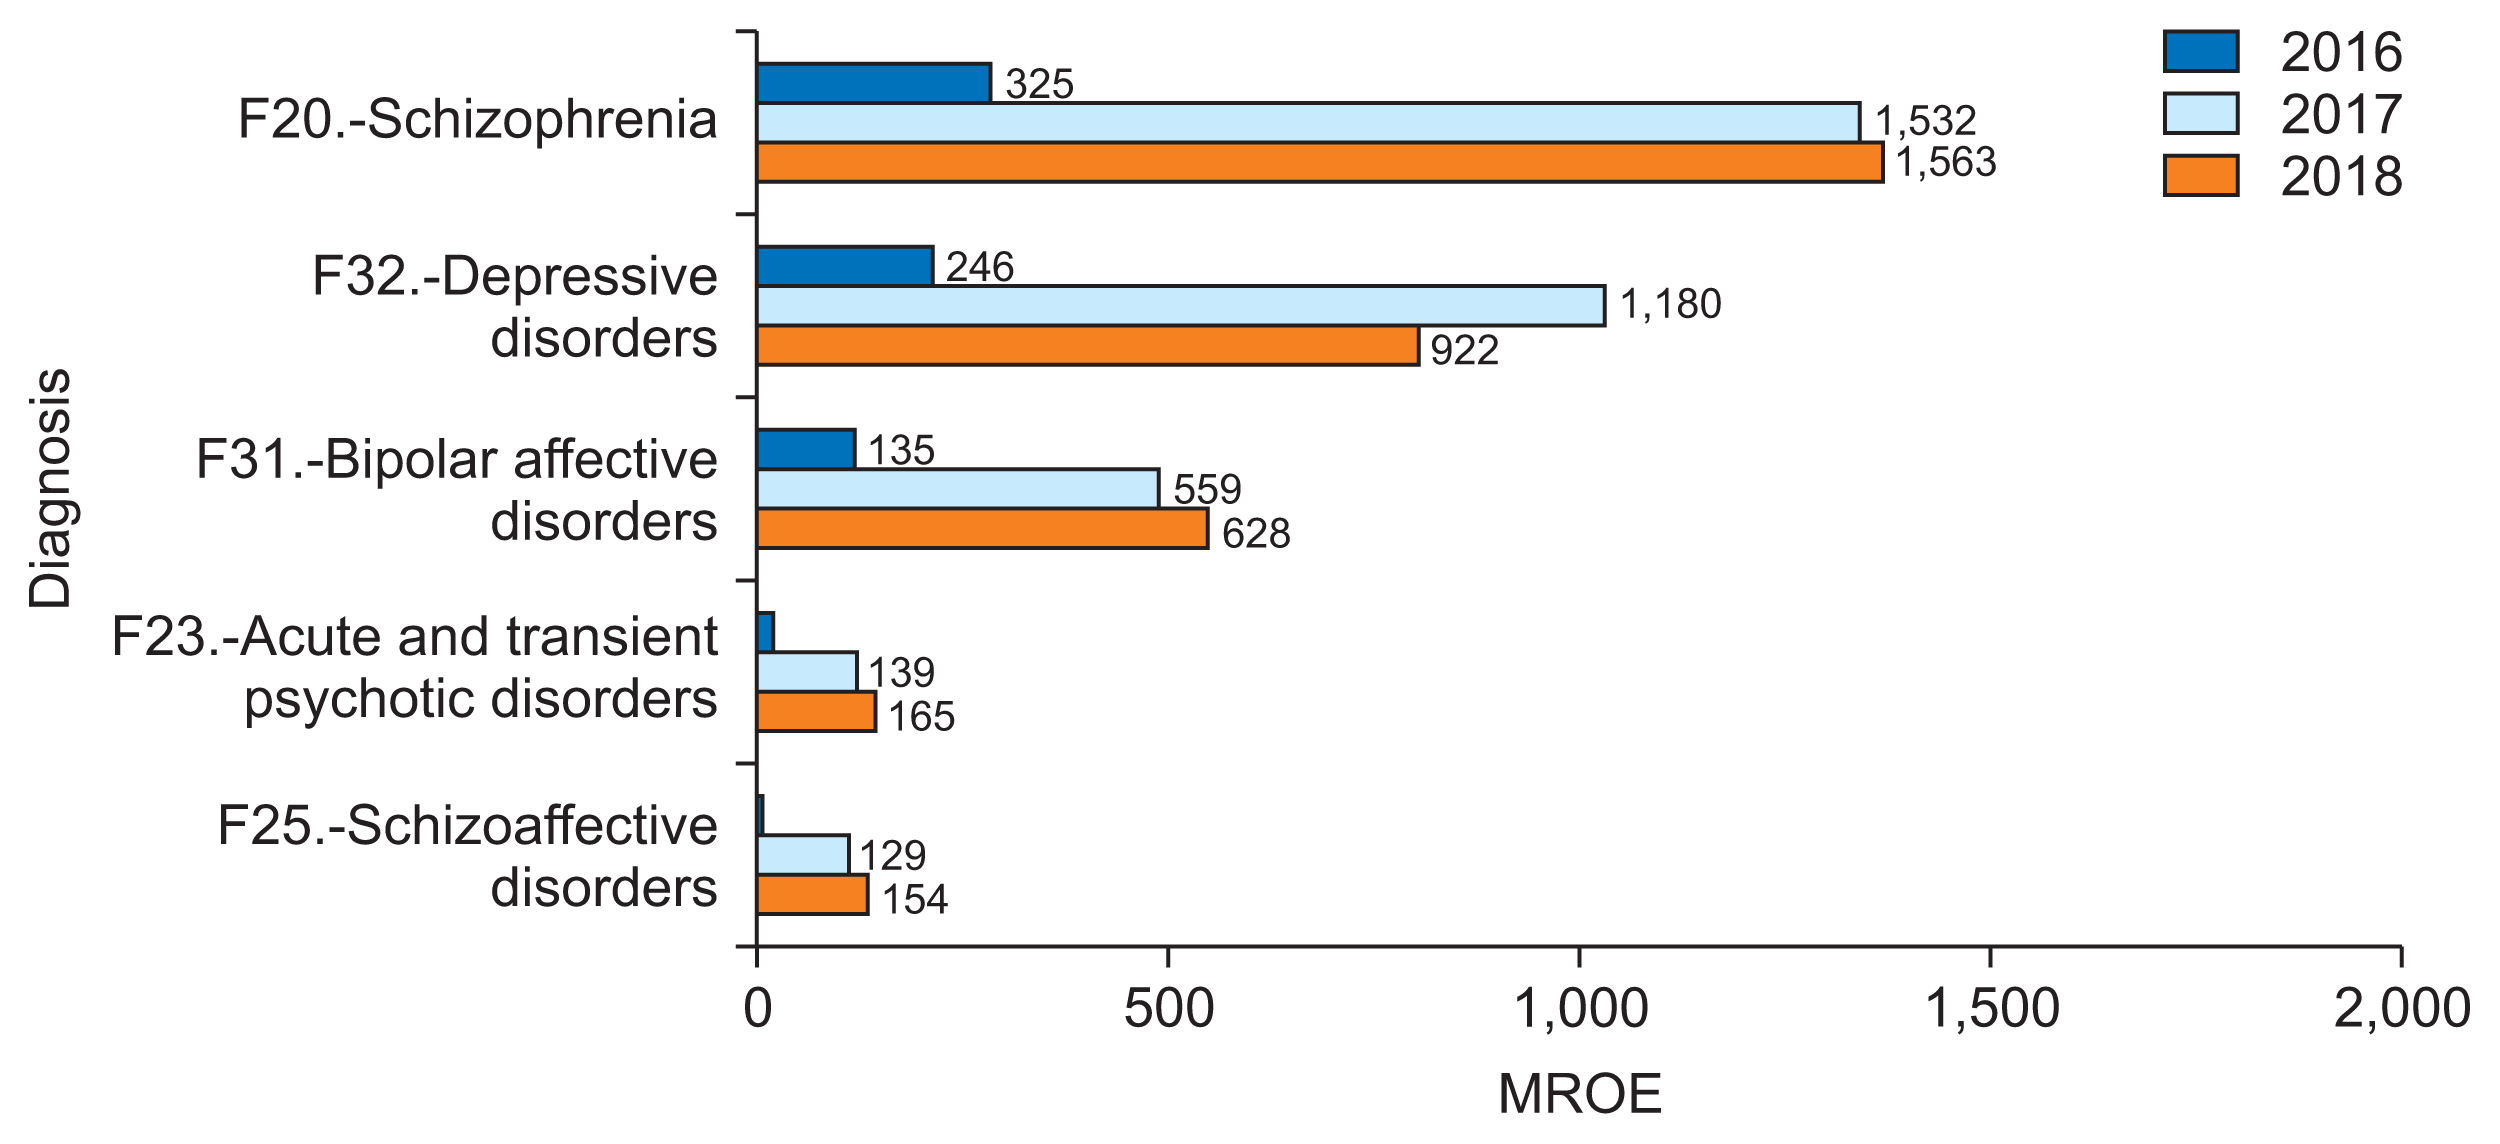
Care insights were obtained according to several medico-economic dimensions, such as socio-demographic factors (sex, marital status), economic factors (patient health insurance), medical factors (diagnosis, clinical scales, hospitalization decision). Figure 5 shows the top five diagnoses according to time dimension, and Figure 6 shows the top five diagnoses according to gender dimension in 2018.
3) Psychiatric drug needs according to prescription
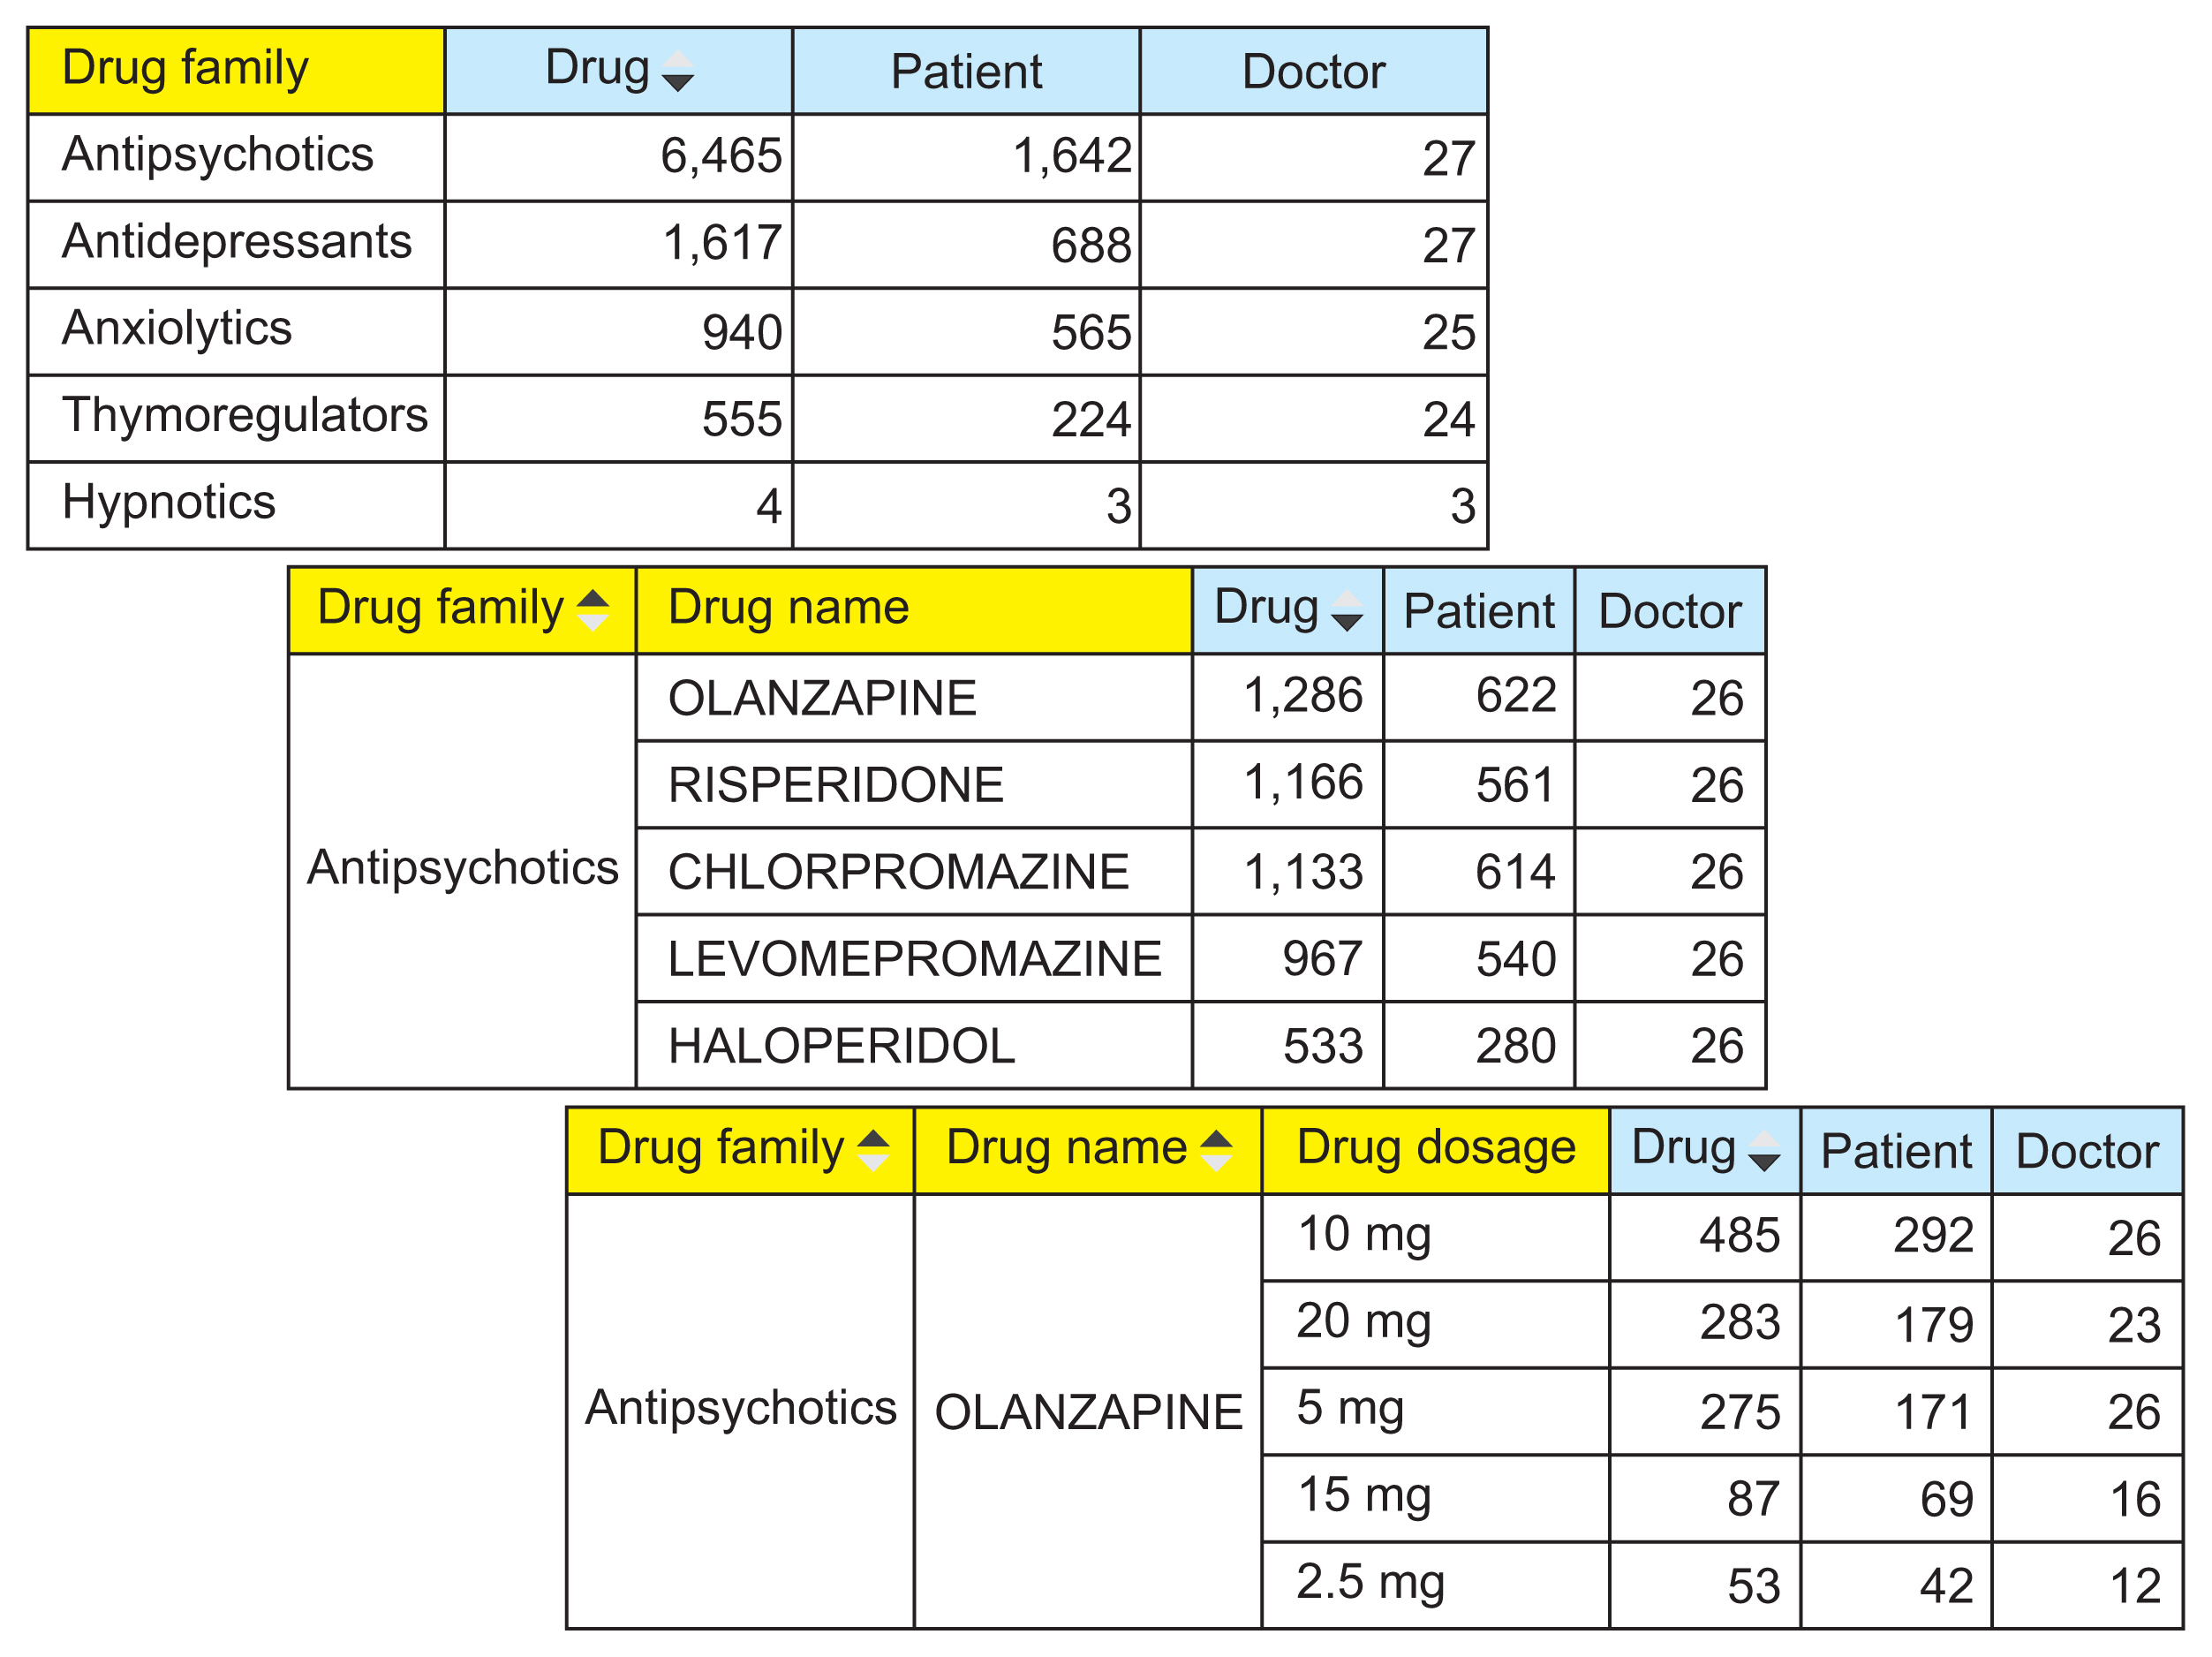
Monitoring drug prescriptions allows CPU to have a real estimation of drug needs. BA Roll UP and Drill Down techniques allow reporting of (1) aggregated measures of drug families, drug specialties or (2) detailed information about a particular prescribed drug (Figure 7).
4) Health professional performance monitoring
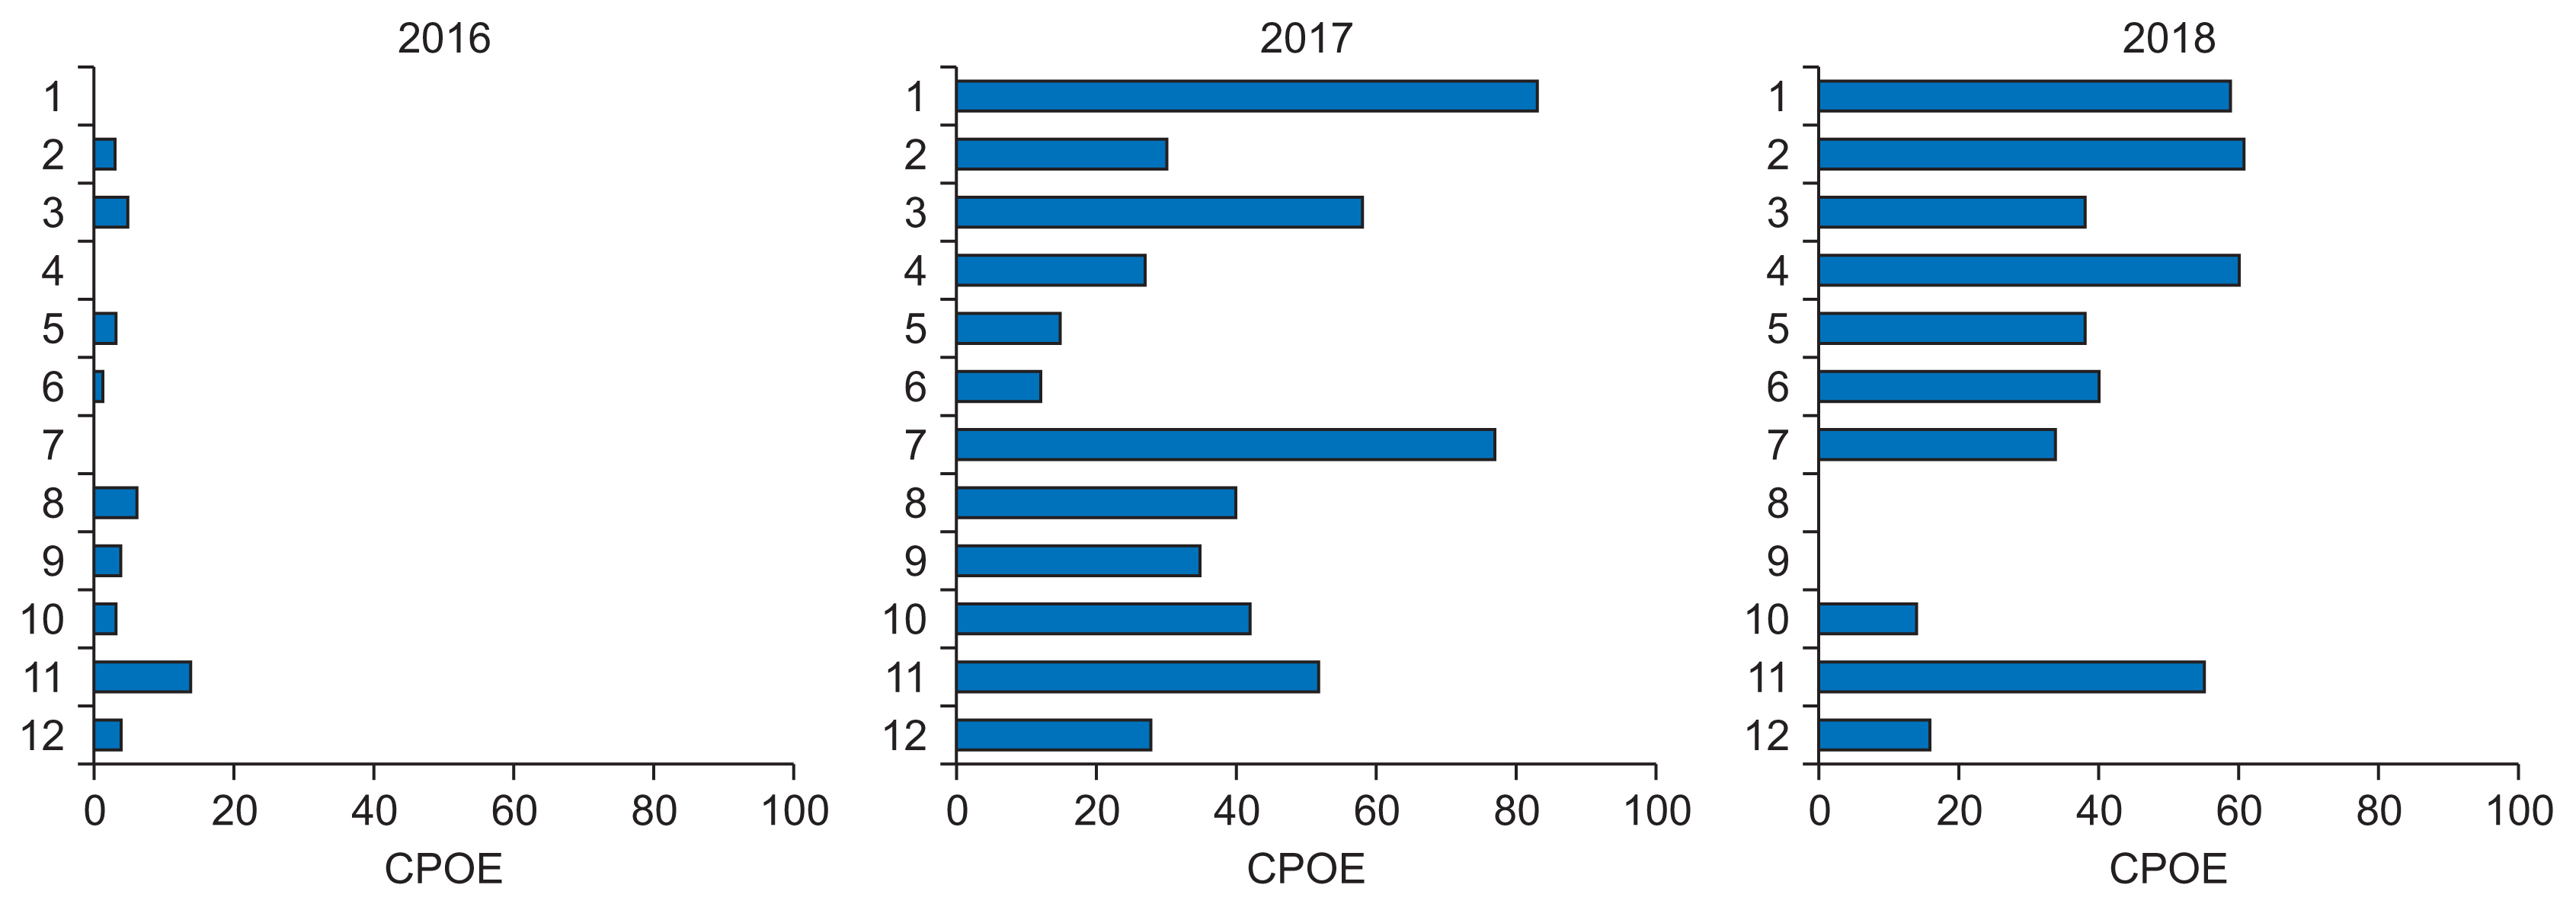
Physician performance was evaluated by monitoring each physician’s monthly number of CPOEs over time. Figure 8 shows a personal follow-up of one physician whose activity drastically improved after the first-year feedback meeting.
5) Outpatient care wait time monitoring
The monthly averaged outpatient care wait time in minutes is presented in Figure 9. A significant progressive decrease was noted (p < 0.0001) between 2018 (68 ± 49), 2017 (81 ± 56) and 2016 (93 ± 56).
6) Psychiatric drugs distribution mapping
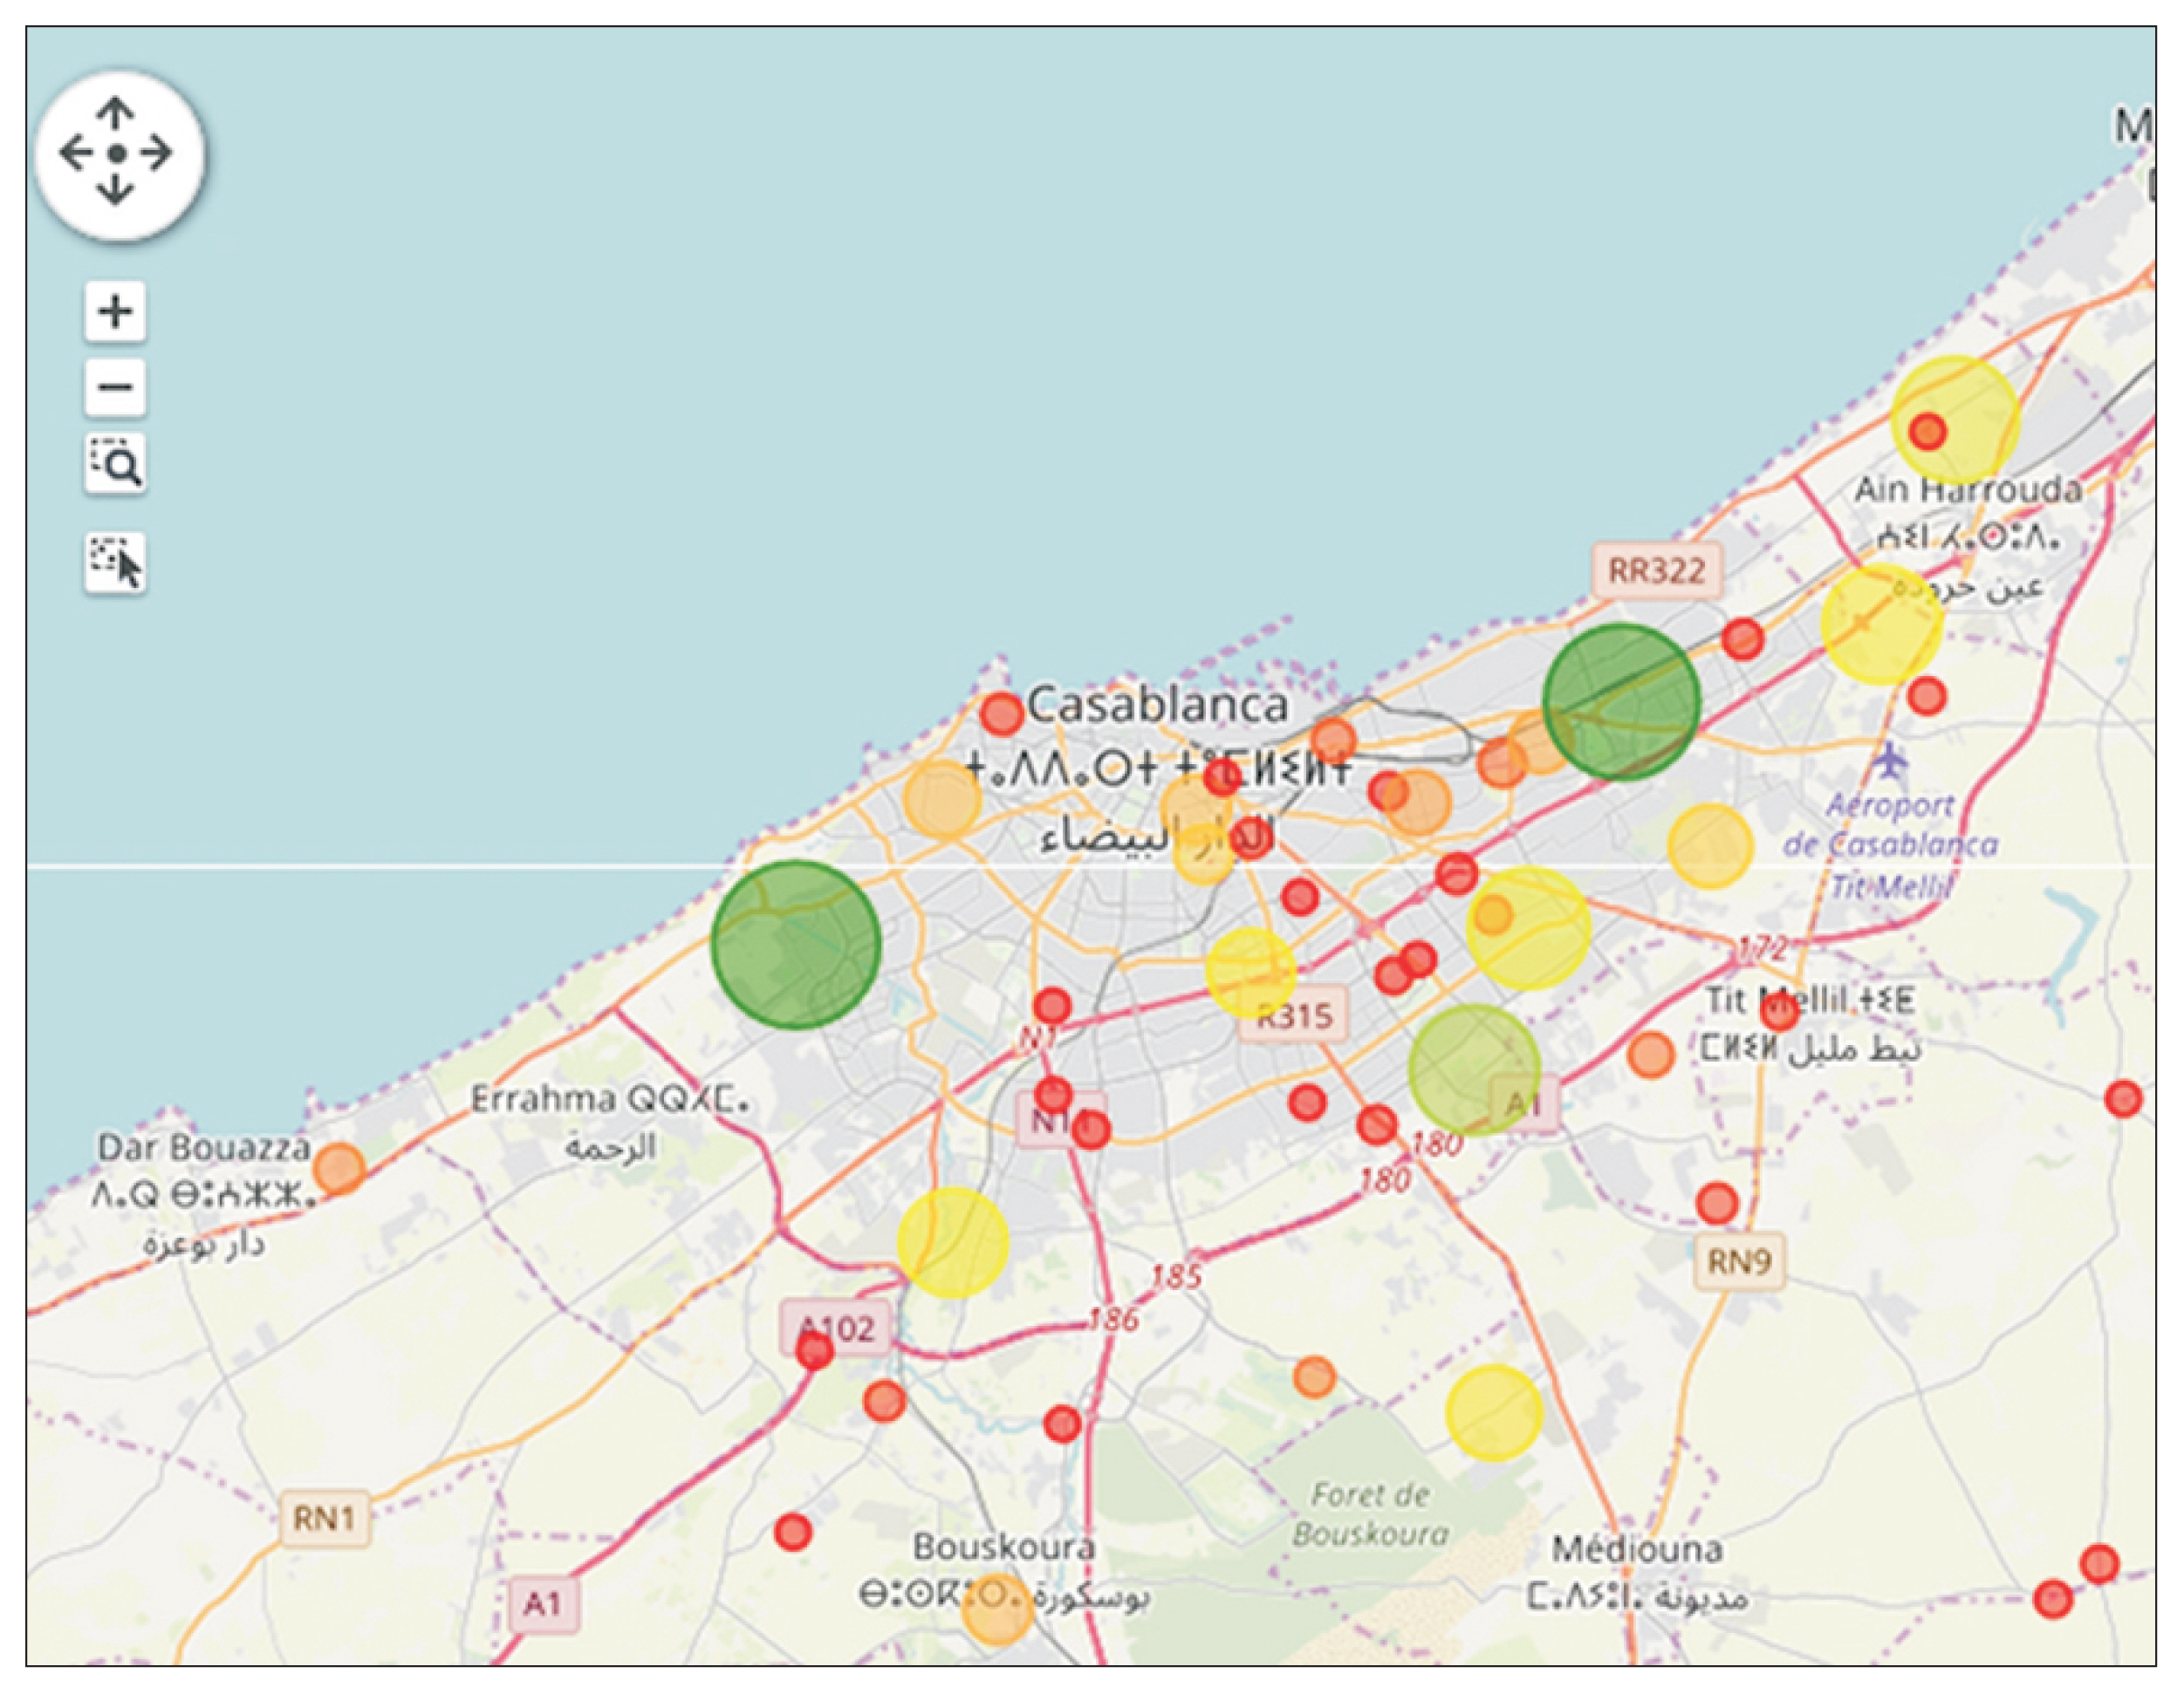
Using a country-based geographical location database [12], a district-based map of prescribed psychiatric drugs weighted by patient count was created (Figure 10). Prescribed psychiatric drugs and patient count are graphically correlated (green color goes with bigger dots).
III. Discussion
In addition to obtaining data-driven quantitative assessment of activity, we also adjusted many CPU business processes according to BA insights:
- EMR adoption was enhanced based on CPOE monitoring. The number of CPOEs significantly increased in 2017 compared to 2016 (Figure 4) due to BA report feedback.
- The significant decrease in the number of CPOEs in 2018 compared to 2017 (Figure 4) coincided with CPU manager (project leader) departure, which spurred the new manager to resume efforts to ensure project sustainability.
- Intern training was adapted to the distribution of mental disorders (Figure 5).
- Drug-need estimation was for the first time data driven (Figure 7).
- Private manager–physician meetings to discuss poor CPOE activity in 2016 (Figure 8) drastically impacted physician performance in subsequent years.
- Outpatient care wait time excessive average in May 2016 (Figure 9) led to better physician leave planning in subsequent years.
- The Mental Health League (non-governmental association dispensing free psychiatric drugs to patients) used a drug-distribution map (Figure 10) to rationalize psychiatric drug dispensing.
Several challenges in BA adoption were encountered in our experience:
- Maturity of strategic needs and business organization: Higher investment in technology may not bring more returns, rather organizational capability acts as a key mediator in value creation [13]. CPU managers are more aware of BA strategy plan need to become a data-driven facility.
- Data quality and governance: Underlying data quality and semantic interoperability systems adoption are data success factors to address in decision-making process [14,15]. To tackle data issues, CPU adopts structured clinical templates and data repositories along with BA fuzzy matching techniques.
- Quality key metrics issues: It is important to identify appropriate metrics to know whether an implemented change represents an improvement over existing processes [16]. Bringing relevant metrics out of the existing EMR system designed only for continuity of care was quite challenging in this project.
- Audit and feedback: Continued auditing and feedback of performance has been recognized as critically important [4,16]. Annual feedback meetings based on BA reports have been a key success factor for project sustainability.
- Reporting and interpreting results: Reporting should be collaborative between health professionals and data scientists who know data limits and weaknesses [17]. Collaboration between CPU medical staff and medical informatics staff was important for interpreting outcomes.
- Evaluation of BA adoption impact on healthcare facility: BA impact on business performance and business value creation implies a multidimensional relationship evaluation model [18]. The relationship between BA and firm performance is to a large degree mediated by process change capabilities [19]. Project stakeholders positively perceive BA impact on business processes and on information processing.
Notes
Conflict of Interest
No potential conflict of interest relevant to this article was reported.

