


I. Introduction
The explosion of internet and mobile phone usage has led to a new type of epidemiology: digital epidemiology. Digital epidemiology has increased in the last decade due to the increasing availability of big data, and advancements in computing power and data analytics methods. The goal of epidemiology is to understand the distribution (who, when, where), and determinants of health and disease conditions in a defined population. Surveillance and descriptive studies can be performed to assess the distribution and analytical studies to identify determinants. The findings of epidemiological studies can be used to control disease and health problems.
Digital epidemiology can be broadly defined as epidemiology that uses digital methods from data collection to data analysis [1]. The goal of digital epidemiology is identical to that of traditional epidemiology. Then, what is the difference between the two? A narrower definition of digital epidemiology is that which uses digital data that was not generated with the primary purpose of epidemiological studies [2]. Examples of such data include search queries, social media posts, webpage access logs, mobile phone network data, data generated by sensors, and data collected at call centers.
A large proportion of sick people search for relevant health information using internet search engines, and many share their experience with the rest of us on social media. Descriptions of health problems, time-stamped and geo-tagged, are available. Thus, it is possible for us to study the health of a population in real time using such digital traces. Researchers have already started to use digital data to support public health surveillance and infectious disease monitoring or to understand public attitudes, perceptions, and behaviors towards health issues.
Google Flu Trends (GFT) is an early example of digital epidemiology, using search queries for the purpose of tracking influenza-like illnesses (ILIs) [3]. In 2009, researchers from Google and the US Centers for Disease Control and Prevention (CDC) published a method to estimate flu activity by region using search queries. For many years, Google Trends (GT) has served as a prime data source for digital epidemiology. Nuti et al. [4] were able to identify 70 articles in a systematic review which used GT in health care research.
However, search queries of GT frequently overestimate the incidence of illness. According to research carried out by a team at Northeastern University and Harvard University, GFT forecasted twice as many influenza cases as actually occurred in the United States during the 2012–2013 flu season [5]. Furthermore, the estimates cannot be reproduced easily because Google data is not publicly available. Twitter became an alternative data source because anyone with an internet connection can retrieve Twitter data.
A group of researchers used data from Twitter to track level of disease activity and concern about the influenza H1N1 pandemic in 2011 [6]. Twitter has also been used to assess health sentiments such as those about vaccination [7] and to monitor drug safety [8]. Wikipedia, another publicly accessible data source, has also been used for digital epidemiology. Researchers at Boston Children's Hospital introduced a method of estimating the level of ILIs, in near-real-time, in the United States by monitoring the rate of influenza-related Wikipedia article views on a daily basis [9].
Mobile phone data has been used to examine the movement of humans and its influence on infectious disease dynamics. For example, Wesolowski et al. [10] analyzed mobile phone call records as indicators of the travel patterns of 15 million mobile phone owners in Kenya over the course of 1 year. They combined the travel patterns with a detailed malaria risk map to estimate the movements of malaria parasites that could be caused by human movement. This information enabled detailed analyses of parasite sources and sinks among hundreds of local settlements. Bengtsson et al. [11] used the position data of subscriber identity module (SIM) cards from the largest mobile phone company in Haiti to estimate the magnitude and trends of population movements following the 2010 Haiti earthquake and cholera outbreak.
Increasing numbers of epidemiological studies are using digital data generated for a purpose other than epidemiology. There are also more freely accessible tools that allow users access to digital data, which may provide deep insight into health-related phenomena and population behavior. However, there is limited knowledge of the uses and limitations of digital data for epidemiological studies. Therefore, we reviewed epidemiological studies that used digital data and classified them by topic domain, purpose, data source, and analytic method, and evaluated their limitations for use in research.
II. Methods
1. Study Selection
We included all research articles published within the last decade that used digital data to answer epidemiological research questions within the domain of healthcare. We included only studies of human epidemiology written in the English language. We excluded studies that primarily focused on plant and animal epidemiology. We also excluded review articles and articles that did not make substantial use of digital data.
2. Search Strategy
We identified relevant articles written in English by searching PubMed using the search terms on digital epidemiology published from September 24, 2008 to September 21, 2018. The key words used in the PubMed search are presented in Table 1.
This search identified 853 potential articles for inclusion. A multistage review process was used to select articles for review. Four authors independently reviewed the titles and abstracts of the retrieved publications. We excluded 753 articles that met at least one of the exclusion criteria. These articles were review, commentary, or perspective articles. They did not use substantial digital data, and they focused on plant or animal epidemiology. In total, 100 articles met our inclusion criteria and were subjected to full-text review by the authors. This resulted in the exclusion of seven survey or intervention studies that utilized social media (Figure 1). A review of the references of the retrieved studies resulted in the identification of 16 further studies. Thus, 109 studies were included for analysis in this review study.
3. Article Classification
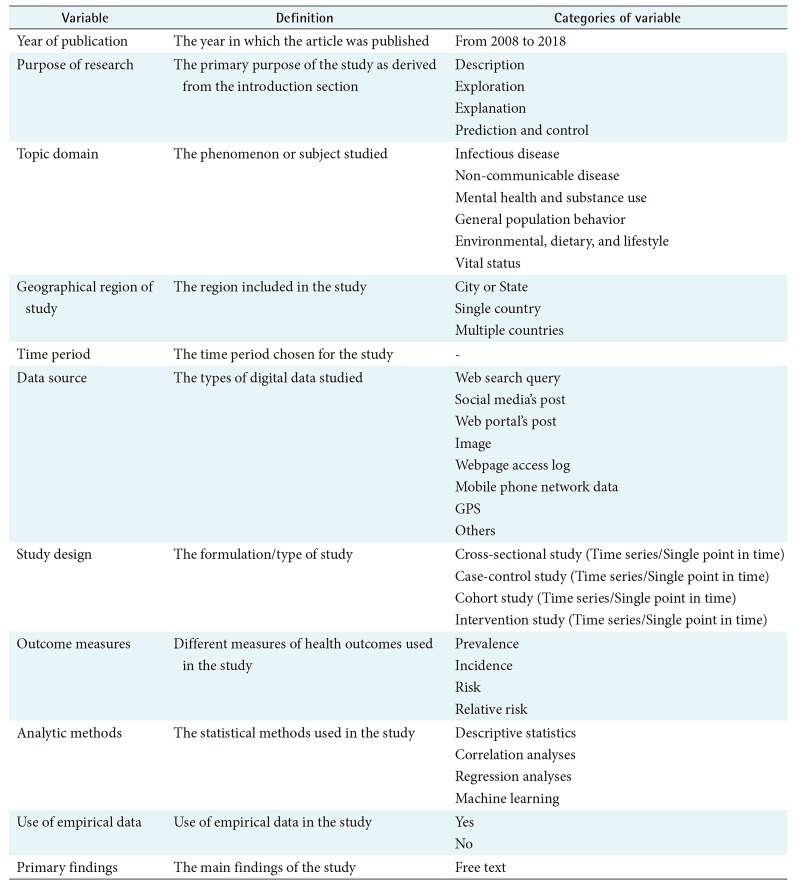
To characterize how researchers use various types of digital data for epidemiological studies, we examined a review article for epidemiological studies [12] and a systematic review of studies with GT data [4] and extracted variables and their categories. The variables included year of publication, purpose of research [13], topic domain, geographical region, time period, study design, outcome measures, and use of empirical data. The topic domain variable is composed of six topics: four of these were based on the classification used by Nuti et al. [4] and two were added by the authors.
Since the data sources and analytic methods of digital epidemiology can be different from those of traditional epidemiology, we included data sources and analytic methods as variables. We created a general descriptive classification of these variables. First, we examined the full text of the articles, and extracted the data sources and analytical methods. Next, we identified and categorized data sources and analytic methods. Then, we classified the articles using these categories.
We classified data sources into the following eight categories: web search query (e.g., Google, Baidu), social media post (e.g., Twitter, blog), web portal post (e.g., HealthMap, proMED), webpage access log (e.g., page views of the National Travel Health Network and Centre and Wikipedia views), image (e.g., Pinterest), mobile phone network data, global positioning system (GPS), and others (drone/balloon, meteorological data, and call center data). We classified analytical methods into the following four categories: descriptive analyses (e.g., relative search volume and number of page views), correlation analyses (e.g., Pearson correlation coefficient, Spearman rank correlation coefficient, and pairwise cross-correlation), regression analyses (e.g., linear regression, logistic regression, jointpoint regression, and negative binomial regression), and machine learning (e.g., support vector machine, decision tree, and artificial neural networks).
4. Variable Abstraction
Data was abstracted from these studies using a data collection tool we developed (Table 2) and disagreements were resolved by consensus. This tool pertains to the purpose of research, methodology (study design, type of analysis) and findings of the studies. We identified the purpose of research by examining the introduction section of the articles. We evaluated the geographic region, data collection period, additional data sources, design, outcome measures, analytic methods, and use of empirical data by examining the methods section of the articles. We extracted primary findings by examining the results section of the articles.
We did not attempt to pool the results due to the heterogeneity of the study outcomes; we instead provide summary statistics of the studies.
III. Results
1. Study Sample
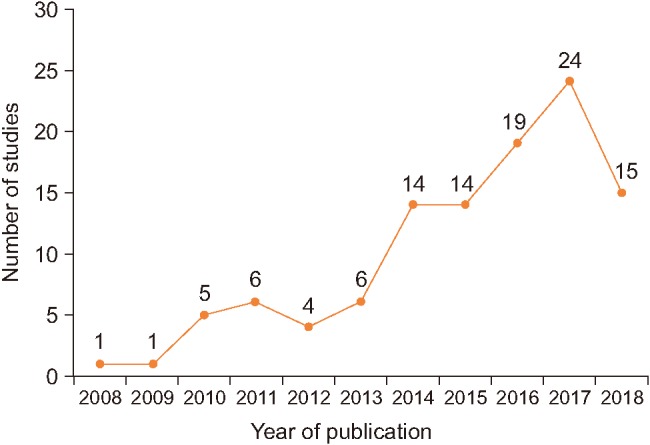
As shown in Figure 2, the number of publications on digital epidemiology has increased over the past decade. Approximately 80% of articles were published from 2014 to 2018.
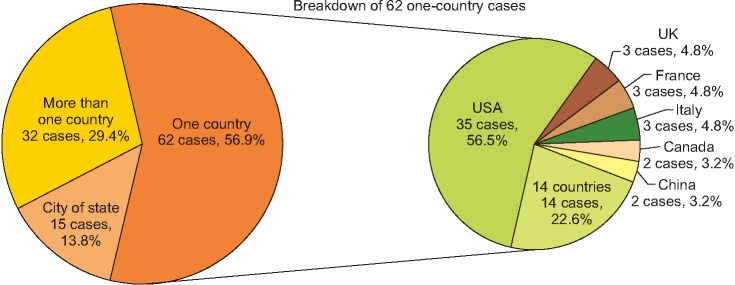
Of these studies, 56.9% were conducted in a single country (Figure 3). Of the 62 studies conducted in a single country, more than half were performed in the United States followed in order by the UK, France, and Italy.
2. Characteristics of the Studies
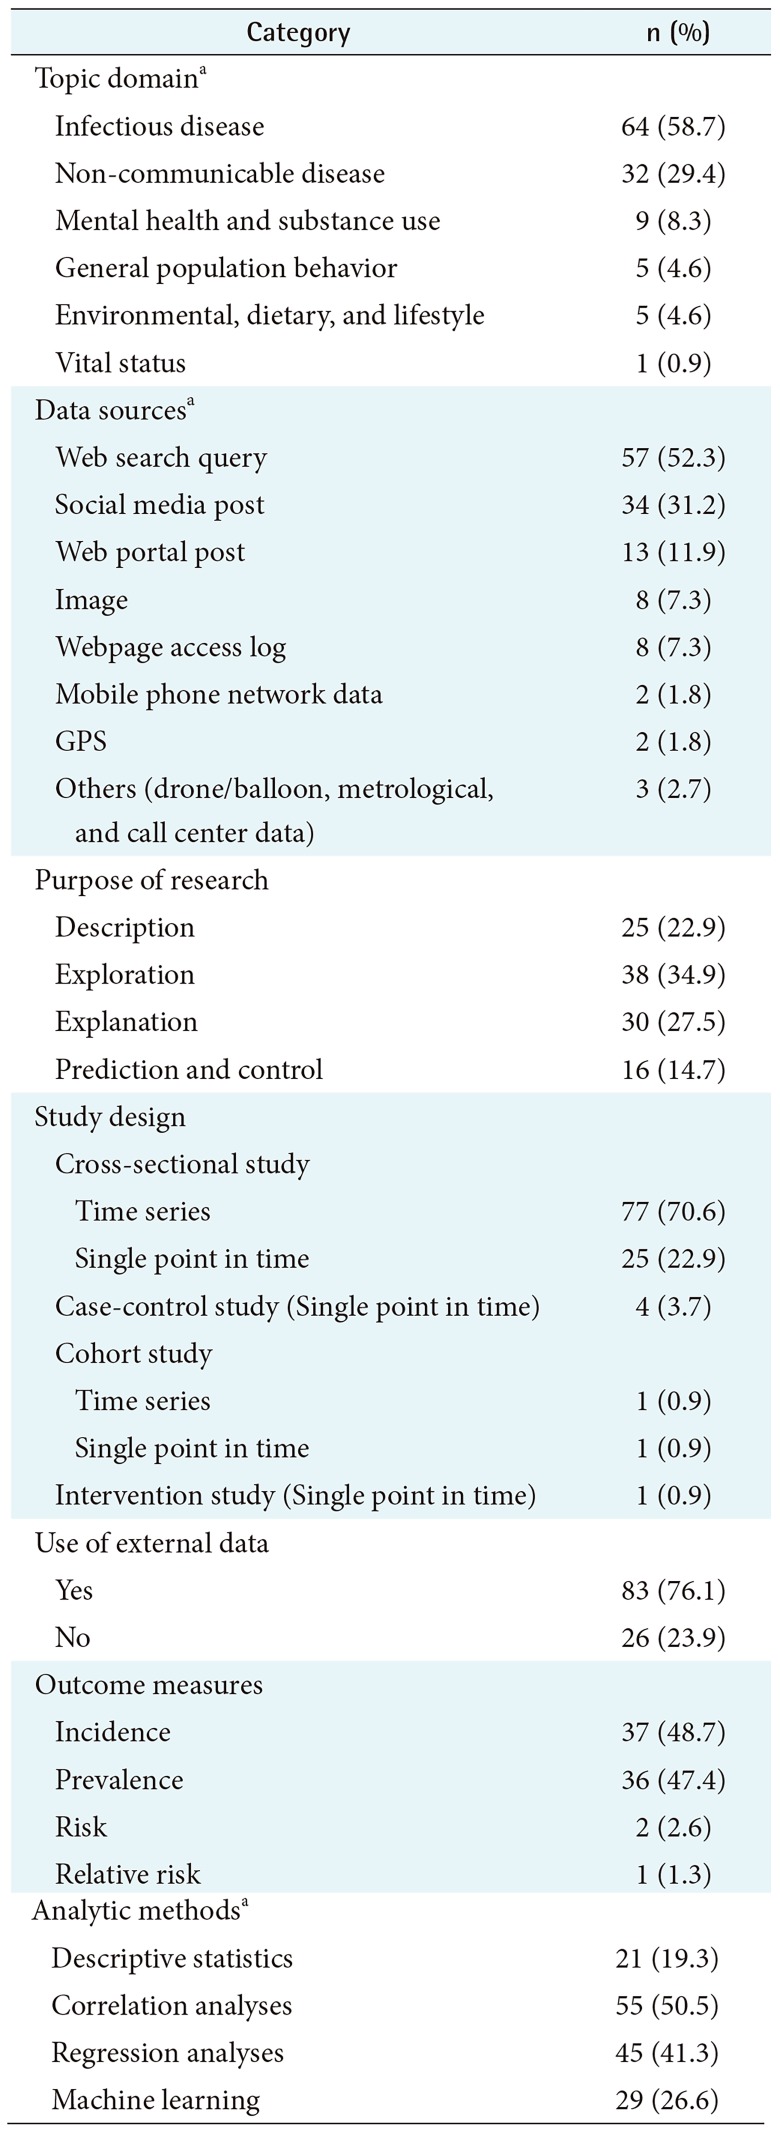
The characteristics of the 109 articles included in this review are summarized in Table 3.
1) Topic domain
We classified the articles by their primary topic. We identified the following six main topic domains: infectious diseases (58.7%), non-communicable diseases (29.4%), mental health and substance use (8.3%), general population behavior (4.6%), environmental, dietary, and lifestyle (4.6%), and vital status (0.9%). The infectious diseases studied included influenza; ILIs; dengue fever; Ebola virus; human immunodeficiency virus (HIV); malaria; Zika virus, tuberculosis; meningococcal disease; cellulitis; chickenpox; chikungunya; hand, foot, and mouth disease; Mayaro virus; West Nile virus disease; Lyme disease; Middle East Respiratory Syndrome (MERS); respiratory virus; norovirus; and Lassa fever. The non-communicable diseases studied included cancer, allergic rhinitis, ragweed pollen allergy, antiphospholipid syndrome, multiple sclerosis, dental caries, type 2 diabetes, asthma, stroke, silicosis, tick paralysis, status epilepticus, interstitial cystitis, chronic cerebrospinal venous insufficiency migraine headache, and Willis-Ekbom disease. The general population behaviors studied included suicide, cancer screening, and population movement. The environmental, dietary, and lifestyle category included foodborne illness, vitamin D, and air quality.
2) Data sources
More than half of the studies (52.3%) used web search queries via search engines such as Google, Baidu, Yandex, Daum and Parsijoo, and 31.2% used social media posts. Most of the social media data was from Twitter and blogs. Online obituaries from funeral home web pages were used to retrieve the vital status of patients with cancer [14] and to examine the cause of death in a cancer-related epidemiological discovery study [15]. Data from balloons and/or drones equipped with infrared cameras and sensors were used as crowdsourced data (such as body temperature) to detect emerging infectious diseases [16].
3) Purpose of research
We identified four study purpose categories: description (22.9%), exploration (34.9%), explanation (27.5%), and prediction and control (14.7%). Descriptive studies focus on presenting phenomena with incidence, size, and/or other measurable attributes. An example of a descriptive study is a study by Moon et al. [17], which investigated internet search rates for vitamin D using GT data and reported seasonal variation in public interest in vitamin D. An explorative study investigates the full nature of the phenomenon, the manner in which it manifests, and other related factors through correlation analyses. An example of such a study is Chary et al. [18], which demonstrated a strong correlation between the geographic variation in social media posts mentioning prescription opioid misuse and government estimates of misuse of prescription opioids. An explanatory study focuses on understanding the underlying causes of a phenomenon or the systematic relationships among variables [13]. An example is Towers et al. [19], which examined whether news coverage was a significant factor in the temporal patterns of Ebola-related Twitter data using a linear regression model. A predictive and controlled study attempts to predict a phenomenon based on research findings. An example is Ram et al. [20], which analyzed Twitter, Google search interests, and air quality index data using machine learning techniques to predict the number of asthma-related emergency department visits in a specific area.
4) Study design
Overall, 70.6% of studies were time series cross-sectional studies, 22.9% were cross-sectional studies at a single point in time, 3.7% were case-control studies, 1.8% were cohort studies, and 0.9% were intervention studies. Most time series cross-sectional studies analyzed digital data to compare phenomena across time periods. An example is Zhang et al. [21], which examined seasonal variation in the volume of Google search queries for cellulitis from 2004 to 2016. An example of cross-sectional study at single point in time is a study that analyzed the types of discourse about Zika virus on Twitter for 2 months [22]. An example of a case-control study is a study by Tourassi et al. [15], which classified study subjects into a case group (females for whom cancer is the stated or inferred cause of death) or a control group (females for whom there was no mention of cancer) using online obituary announcements in order to examine the association between parity and cancer risk. An example of an intervention study is Edoh's study [16] which conducted an experiment using large range/distance temperature sensors and drones in order to collect infectious diseases-related data from study participants.
5) Use of external data
Most articles (76.1%) used ground truth data to measure the relationship between digital data and the gold standard or to develop and validate models. Examples of ground truth data include reports published by governments or the World Health Organization, census statistics, data obtained from scientific studies, and news data. For example, Phillips et al. [23] used cancer incidence reported by the CDC to characterize the relationship between cancer incidence and online Google search volumes in the United States for six common types of cancer.
6) Outcome measures
Of the studies with outcome measures, 48.7% estimated the incidence of infectious diseases or other problems. For example, McGough et al. [24] evaluated the feasibility of using Zika-related Google search queries, Twitter, and news reports collected by HealthMap to dynamically track and predict the incidence of Zika virus up to 3 weeks ahead of the release of official reports. In addition, 47.4% assessed disease prevalence. For example, McIver and Brownstein [9] estimated the prevalence of ILIs in the United States in near-real-time by monitoring the rates of Wikipedia article views.
7) Analytic methods
Overall, 50.5% of the studies used correlation analyses, 41.3% used regression analyses, 25.6% used machine learning techniques, and 19.3% used descriptive analyses. Linear regression analyses were the most frequently used type of regression analysis. Generous et al. [25] used a linear regression model to examine the potential of Wikipedia access logs as an emerging data source for global disease surveillance and forecasting. Machine learning techniques have prominently been used since 2014, and support vector machine has been the most frequently used. Adrover et al. [26] assessed whether adverse effects of HIV drug treatment and associated sentiments can be determined using Twitter. They utilized boosted decision trees, support vector machines, and artificial neural networks as machine-learning classifiers.
IV. Discussion
Researchers are increasingly utilizing digital data in a wide variety of areas in multiple ways. Examples include use of online obituaries from funeral home websites for near real-time surveillance of mortality [14], a study of the relationship between restaurant table availabilities and an increase in disease incidence, specifically ILIs [27], use of meteorological data to study the spatiotemporal clustering of dengue cases and climate [28], and use of a female-oriented social media site, Pinterest, for skin cancer education [29].
We reviewed 109 epidemiological studies that investigated the distribution, and determinants of health and conditions using digital data. The number of such publications increased over time from 1 article in 2008 to 24 articles in 2017 and 15 articles in the first half of 2018. This trend suggests increasing awareness and leveraging of digital data for epidemiological studies.
The geographic regions in which studies were conducted varied from a single city to multiple countries. More than half of studies (56.9%) used digital data collected in a single country. The United States topped the list of countries with 35 studies, followed by the UK, France, and Italy with 3 studies each. Use of digital methods in collecting and analyzing data can be challenging in the resource-poor countries. Examples of epidemiological studies in a city or state include a study of a community outbreak of meningococcal disease using a regional online newspaper in Sardinia, Italy [30], and a study of the main drivers of the temporal and spatiotemporal dynamics of the 2014 chikungunya outbreak using Twitter data in Martinique, France [31]. Examples of epidemiological studies in more than one country include evaluation of GFT data in low-to middle-income Latin America [32], and use of HealthMap to categorize and quantify MERS alerts [33].
The studies included in this review reflect a wide variety of topics. Infectious disease was the most frequently studied topic (64 studies), followed by non-communicable diseases (32 studies). Of the 64 studies on infectious disease, 22 focused on influenza or ILIs. This finding is slightly different from the review by Nuti et al. [4] of GT articles, in which infectious disease was the second most popular topic domain following general population behavior (including all healthrelated behaviors).
Most studies have used internet-based data sources such as web search queries (57 studies) followed by social media posts (34 studies), web portal posts (13 studies), and webpage access logs (8 studies). Other data sources have included mobile phone networks, GPS, drones/balloons, and call centers. Epidemiological studies using digital data in underdeveloped countries tend to use data from devices because of the typically poor internet connections in such regions. For example, long-range/-distance temperature sensors and drones were used to collect infectious disease-related data from study participants in Africa [16]. Mobile phone data was used to study the travel patterns and malaria risk for the population of Kenya [10], and to examine the magnitude and trends of population movements following the earthquake and cholera outbreak in Haiti [11].
Regarding the purposes of the studies, almost equal numbers of studies used digital data for descriptive, explorative, explanatory, and predictive and controlled studies. However, explorative studies were the most frequent type (38 studies) followed by explanatory studies (30 studies).
Regarding study design, time series cross-sectional studies were the most frequent (77 studies, 70.6%) followed by single point in time cross-sectional studies (25, 22.9%). In traditional epidemiological studies, the most frequently used method is cross-sectional regression. However, the use of digital data collected across a time period enables the modeling of effects across time and space.
A majority of the studies (76.1%) used external datasets as outcome variables for model development or outcome validation. Regarding outcome measures, incidence and prevalence were the most common measures used in digital epidemiological studies.
A majority of the studies used correlation analyses to examine the relationships among variables (55 studies) followed by various regression analyses (45 studies), such as linear regression, jointpoint regression, and Least Absolute Shrinkage and Selection Operator regression.
We examined how digital data collected for non-epidemiological purposes is being used for epidemiologic purposes. Digital epidemiological studies require large datasets and advanced analytics such as machine learning. Most machine learning algorithms are openly available due to the strong open source software movement. Thus, it is important to ensure that as much data as possible are openly accessible. As Salathe [2] elaborated so well in his review article, this is clearly at odds with the desire to have as little personal data as possible publicly accessible to protect individual privacy. There is no straightforward solution to this conflict of interest between open access to large data sets and privacy protection, but Salathe [2] proposed data cooperatives with restricted access as a solution.
Our study had certain limitations. First, given the diversity of topics and uses, there were inherent challenges in the classification of articles. However, four authors independently reviewed each article and category of abstraction, and disagreements were resolved by consensus. Second, there are no prior standards to follow for evaluating literature from novel digital data sources such as search engines, social media services, and mobile phones. Finally, there was the possibility of incomplete retrieval of articles on digital epidemiology using our search strategy. We reviewed the references sections of articles to capture as many articles as possible and performed an extensive search of the PubMed database. Notably, we focused on evaluating the use of digital data for epidemiological studies and refrained from making any comments on the conclusions drawn by researchers. Further studies should evaluate the interpretation and validity of use of digital data for epidemiological studies.