Healthc Inform Res Search

CLOSE


Healthc Inform Res > Volume 30(1); 2024 > Article
Chanudom, Tharavichitkul, and Laosiritaworn: Prediction of Cervical Cancer Patients’ Survival Period with Machine Learning Techniques

Abstract

Objectives

The objective of this research is to apply machine learning (ML) algorithms to predict the survival of cervical cancer patients. The aim was to address the limitations of traditional statistical methods, which often fail to provide accurate answers due to the complexity of the problem.

Methods

This research employed visualization techniques for initial data understanding. Subsequently, ML algorithms were used to develop both classification and regression models for survival prediction. In the classification models, we trained the algorithms to predict the time interval between the initial diagnosis and the patient’s death. The intervals were categorized as “<6 months,” “6 months to 3 years,” “3 years to 5 years,” and “>5 years.” The regression model aimed to predict survival time (in months). We used attribute weights to gain insights into the model, highlighting features with a significant impact on predictions and offering valuable insights into the model’s behavior and decision-making process.

Results

The gradient boosting trees algorithm achieved an 81.55% accuracy in the classification model, while the random forest algorithm excelled in the regression model, with a root mean square error of 22.432. Notably, radiation doses around the affected areas significantly influenced survival duration.

Conclusions

Machine learning demonstrated the ability to provide high-accuracy predictions of survival periods in both classification and regression problems. This suggests its potential use as a decision-support tool in the process of treatment planning and resource allocation for each patient.

I. Introduction

Cancer remains one of the most significant global health challenges [1,2]. Among the various types of cancer affecting women worldwide, cervical cancer (CC) is particularly dangerous [3,4]. In 2020, CC ranked as the fourth most common cancer among women, with 604,000 new cases and 342,000 deaths globally [5]. However, CC is one of the cancers that can be treated most effectively when detected early and managed properly [6]. Thus, early detection and appropriate treatment can substantially reduce the mortality risk. CC is prevalent in low- and middle-income countries due to limited access to public health services, therapies, and timely screening. Additionally, there are several risk factors, including early age at first marriage, multiple pregnancies, multiple sexual partners, poor nutrition, inadequate genital hygiene, and infection with human papillomavirus (HPV). In particular, HPV types 16 and 18 are high-risk types that are the main causes of CC [5,7,8].
Accurate estimates of survival during a patient’s follow-up period are of paramount importance to both patients and healthcare professionals. Survival rates are a particularly compelling subject in many clinical research studies, as they can offer personalized prognoses, inform adjustments to follow-up schedules, and help prevent unnecessary treatments. Traditionally, survival rates have been predicted using statistical methods that take into account various factors, such as tumor stage at diagnosis, patient age, and overall health [911]. However, accurately interpreting the factors that influence these results necessitates a solid grasp of statistical evaluation, comparison, and analysis. Additionally, statistical methods often face limitations when dealing with nonlinear data [1214].
Recently, machine learning (ML) has gained popularity in medical research. Its ability to learn from complex and large datasets and generate highly accurate predictions makes it particularly well-suited for analyzing medical data [15,16]. Recent studies have shown that ML outperforms traditional statistical methods in survival prediction, especially when handling multiple variables [17]. Research on survival analysis across various types of cancer indicates that ML techniques can achieve classification accuracy rates of approximately 70%–90% and a root mean square error (RMSE) not exceeding 20 for regression tasks [9,1821]. However, these techniques have not yet been applied to CC datasets. This research aimed to bridge this gap by utilizing ML to predict survival outcomes for CC patients. The goal was to provide more reliable and precise results that could greatly enhance decision-making regarding individualized prognoses for healthcare professionals. Additionally, this study will serve as a pilot for applying ML techniques to other diseases.

II. Methods

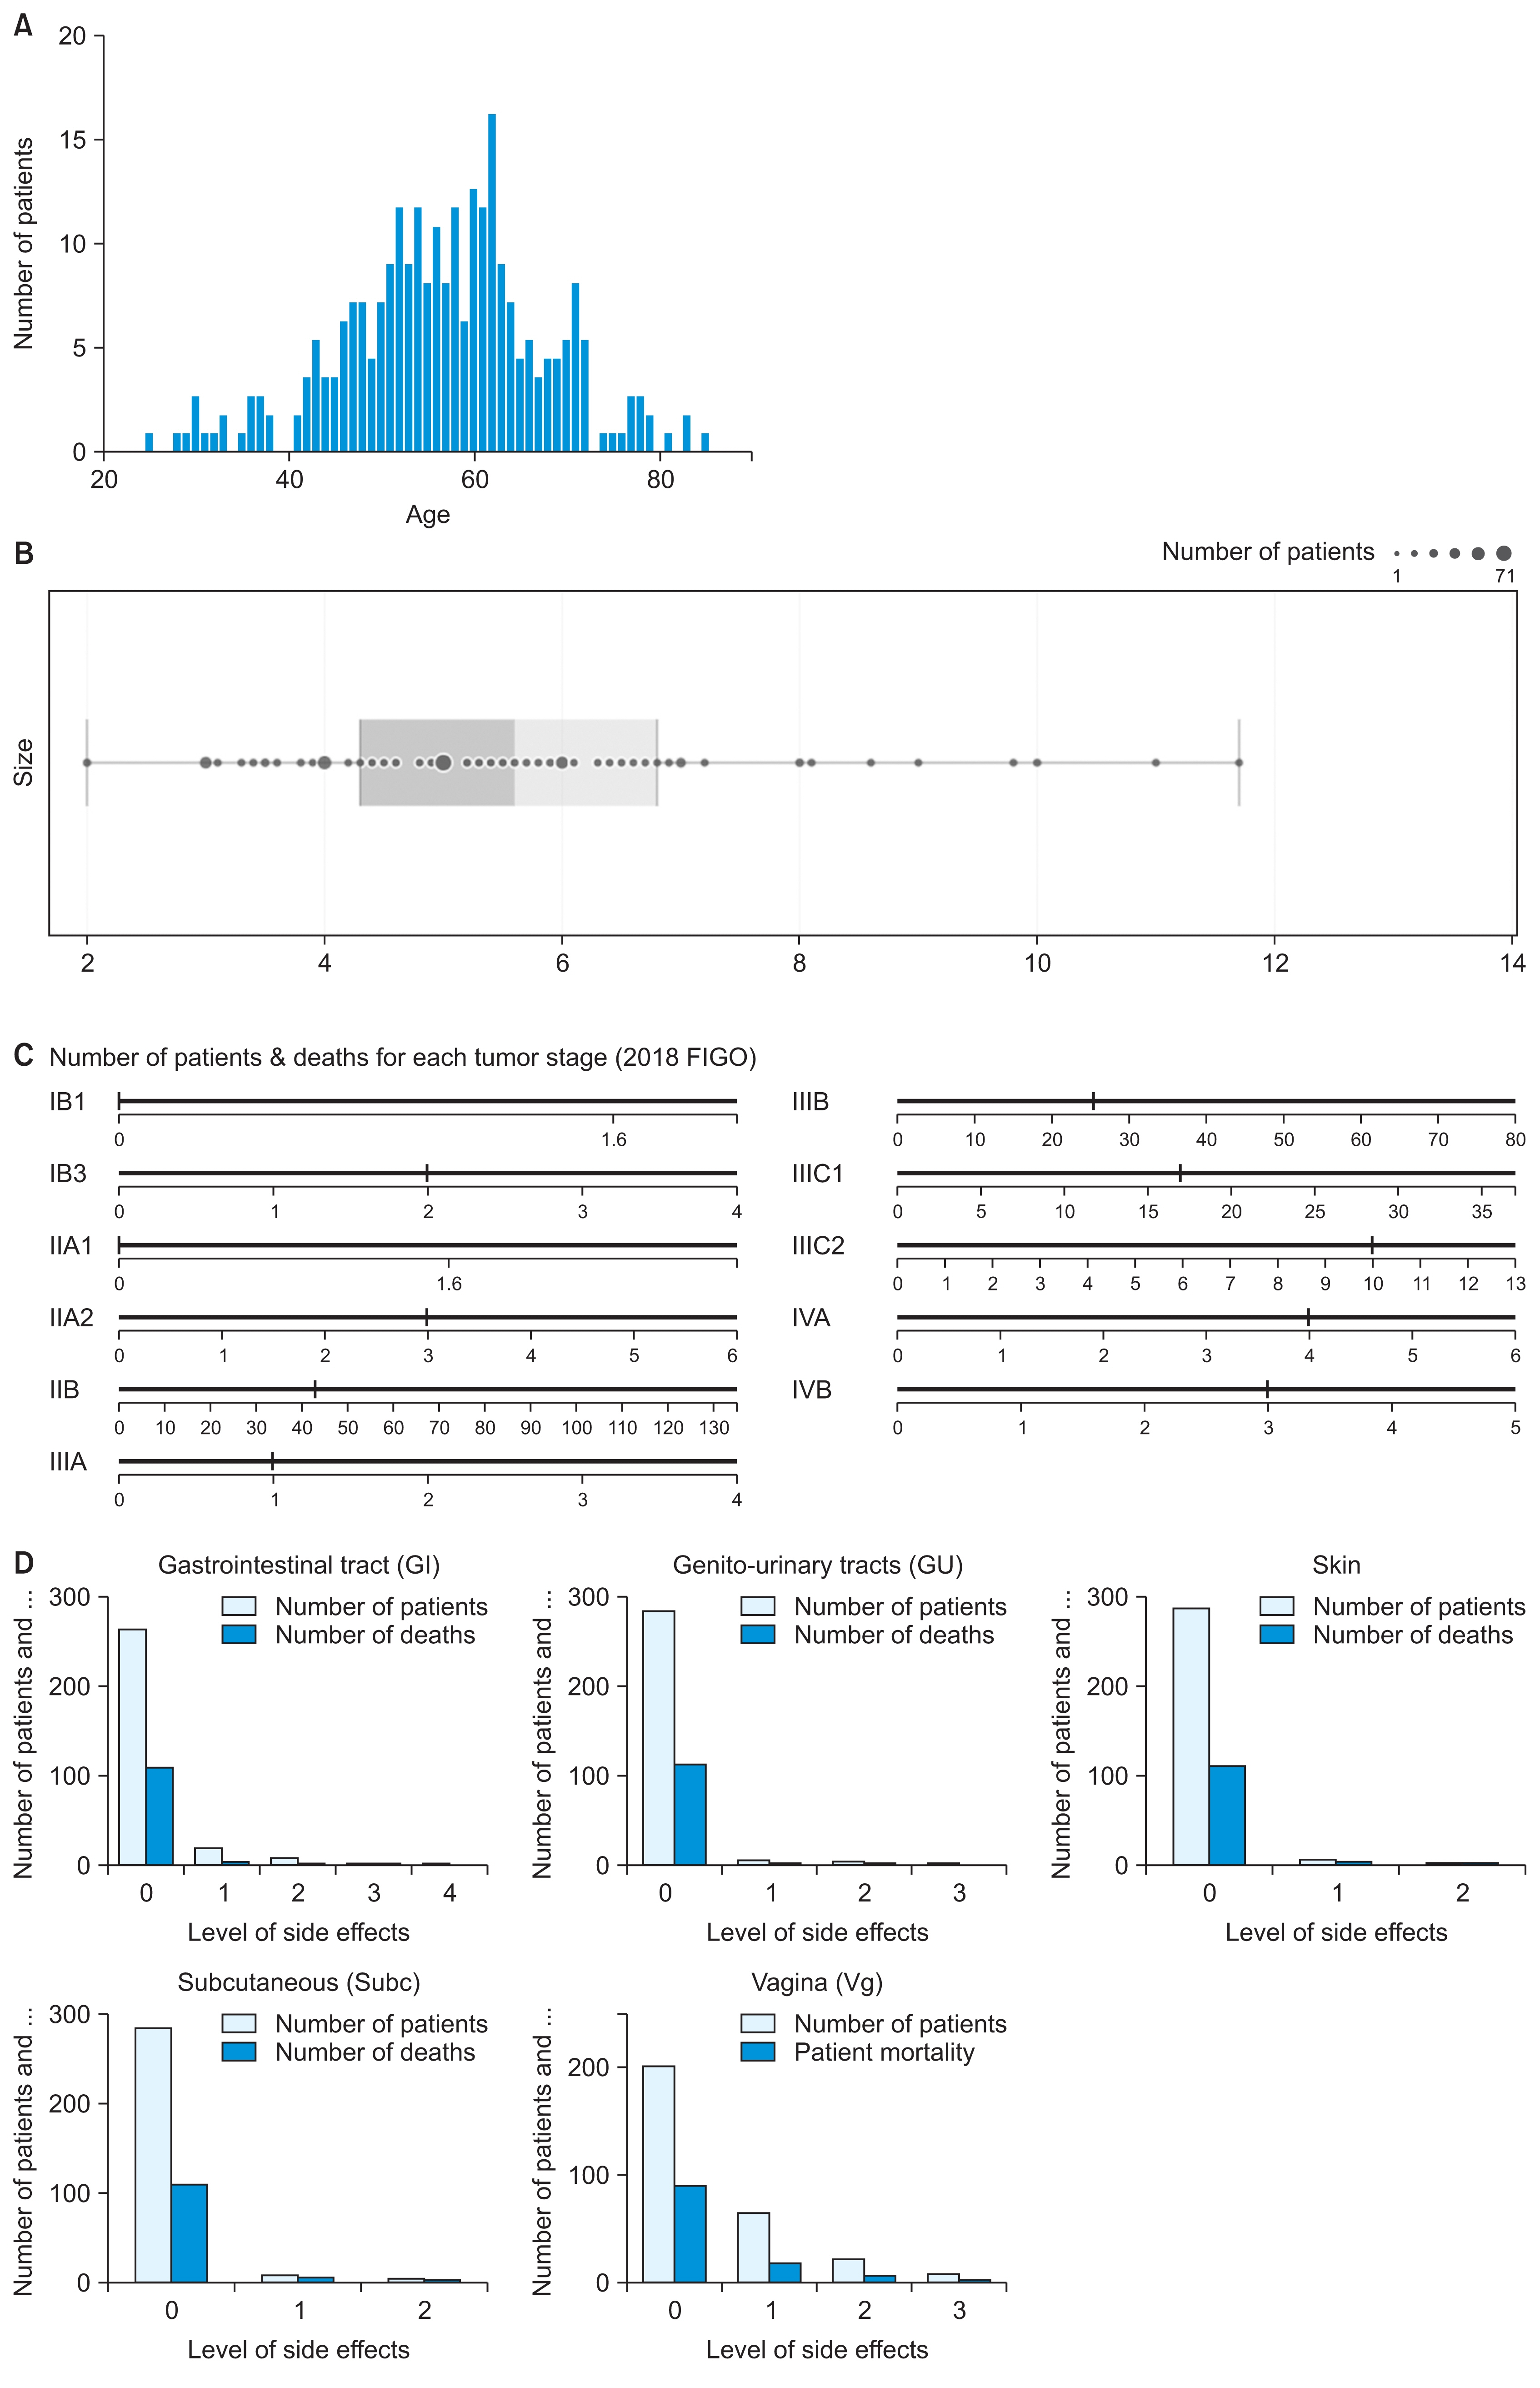
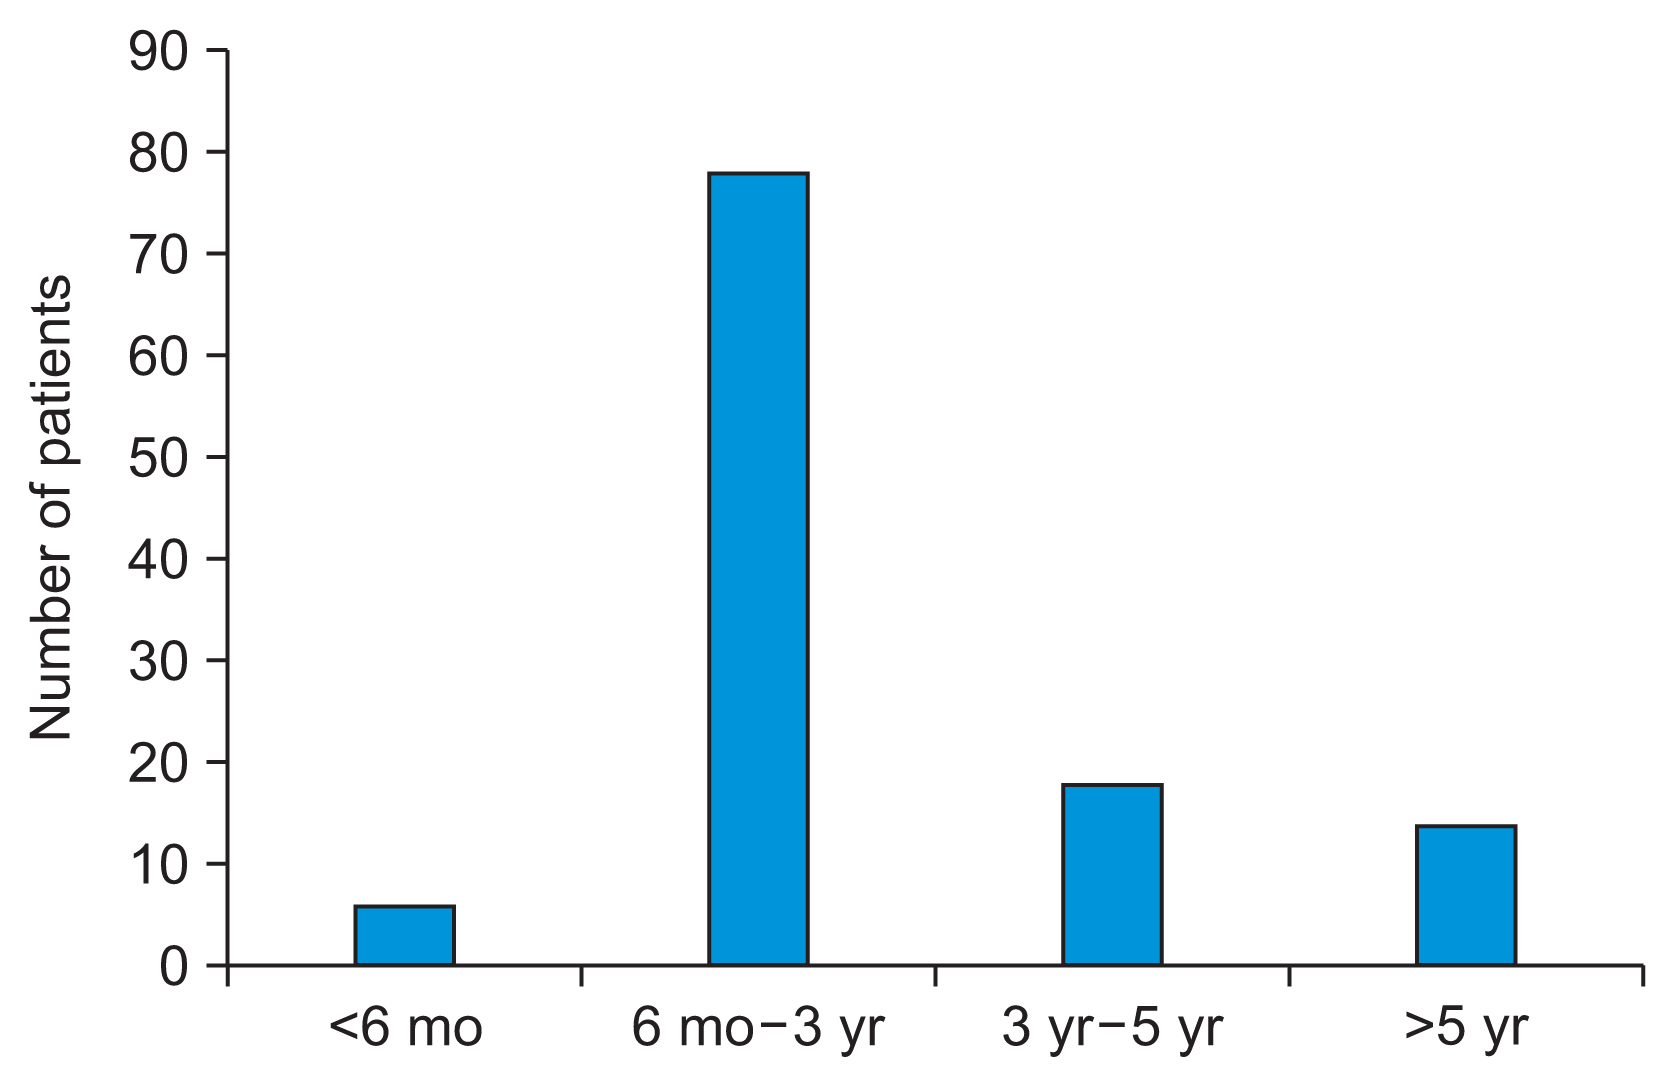
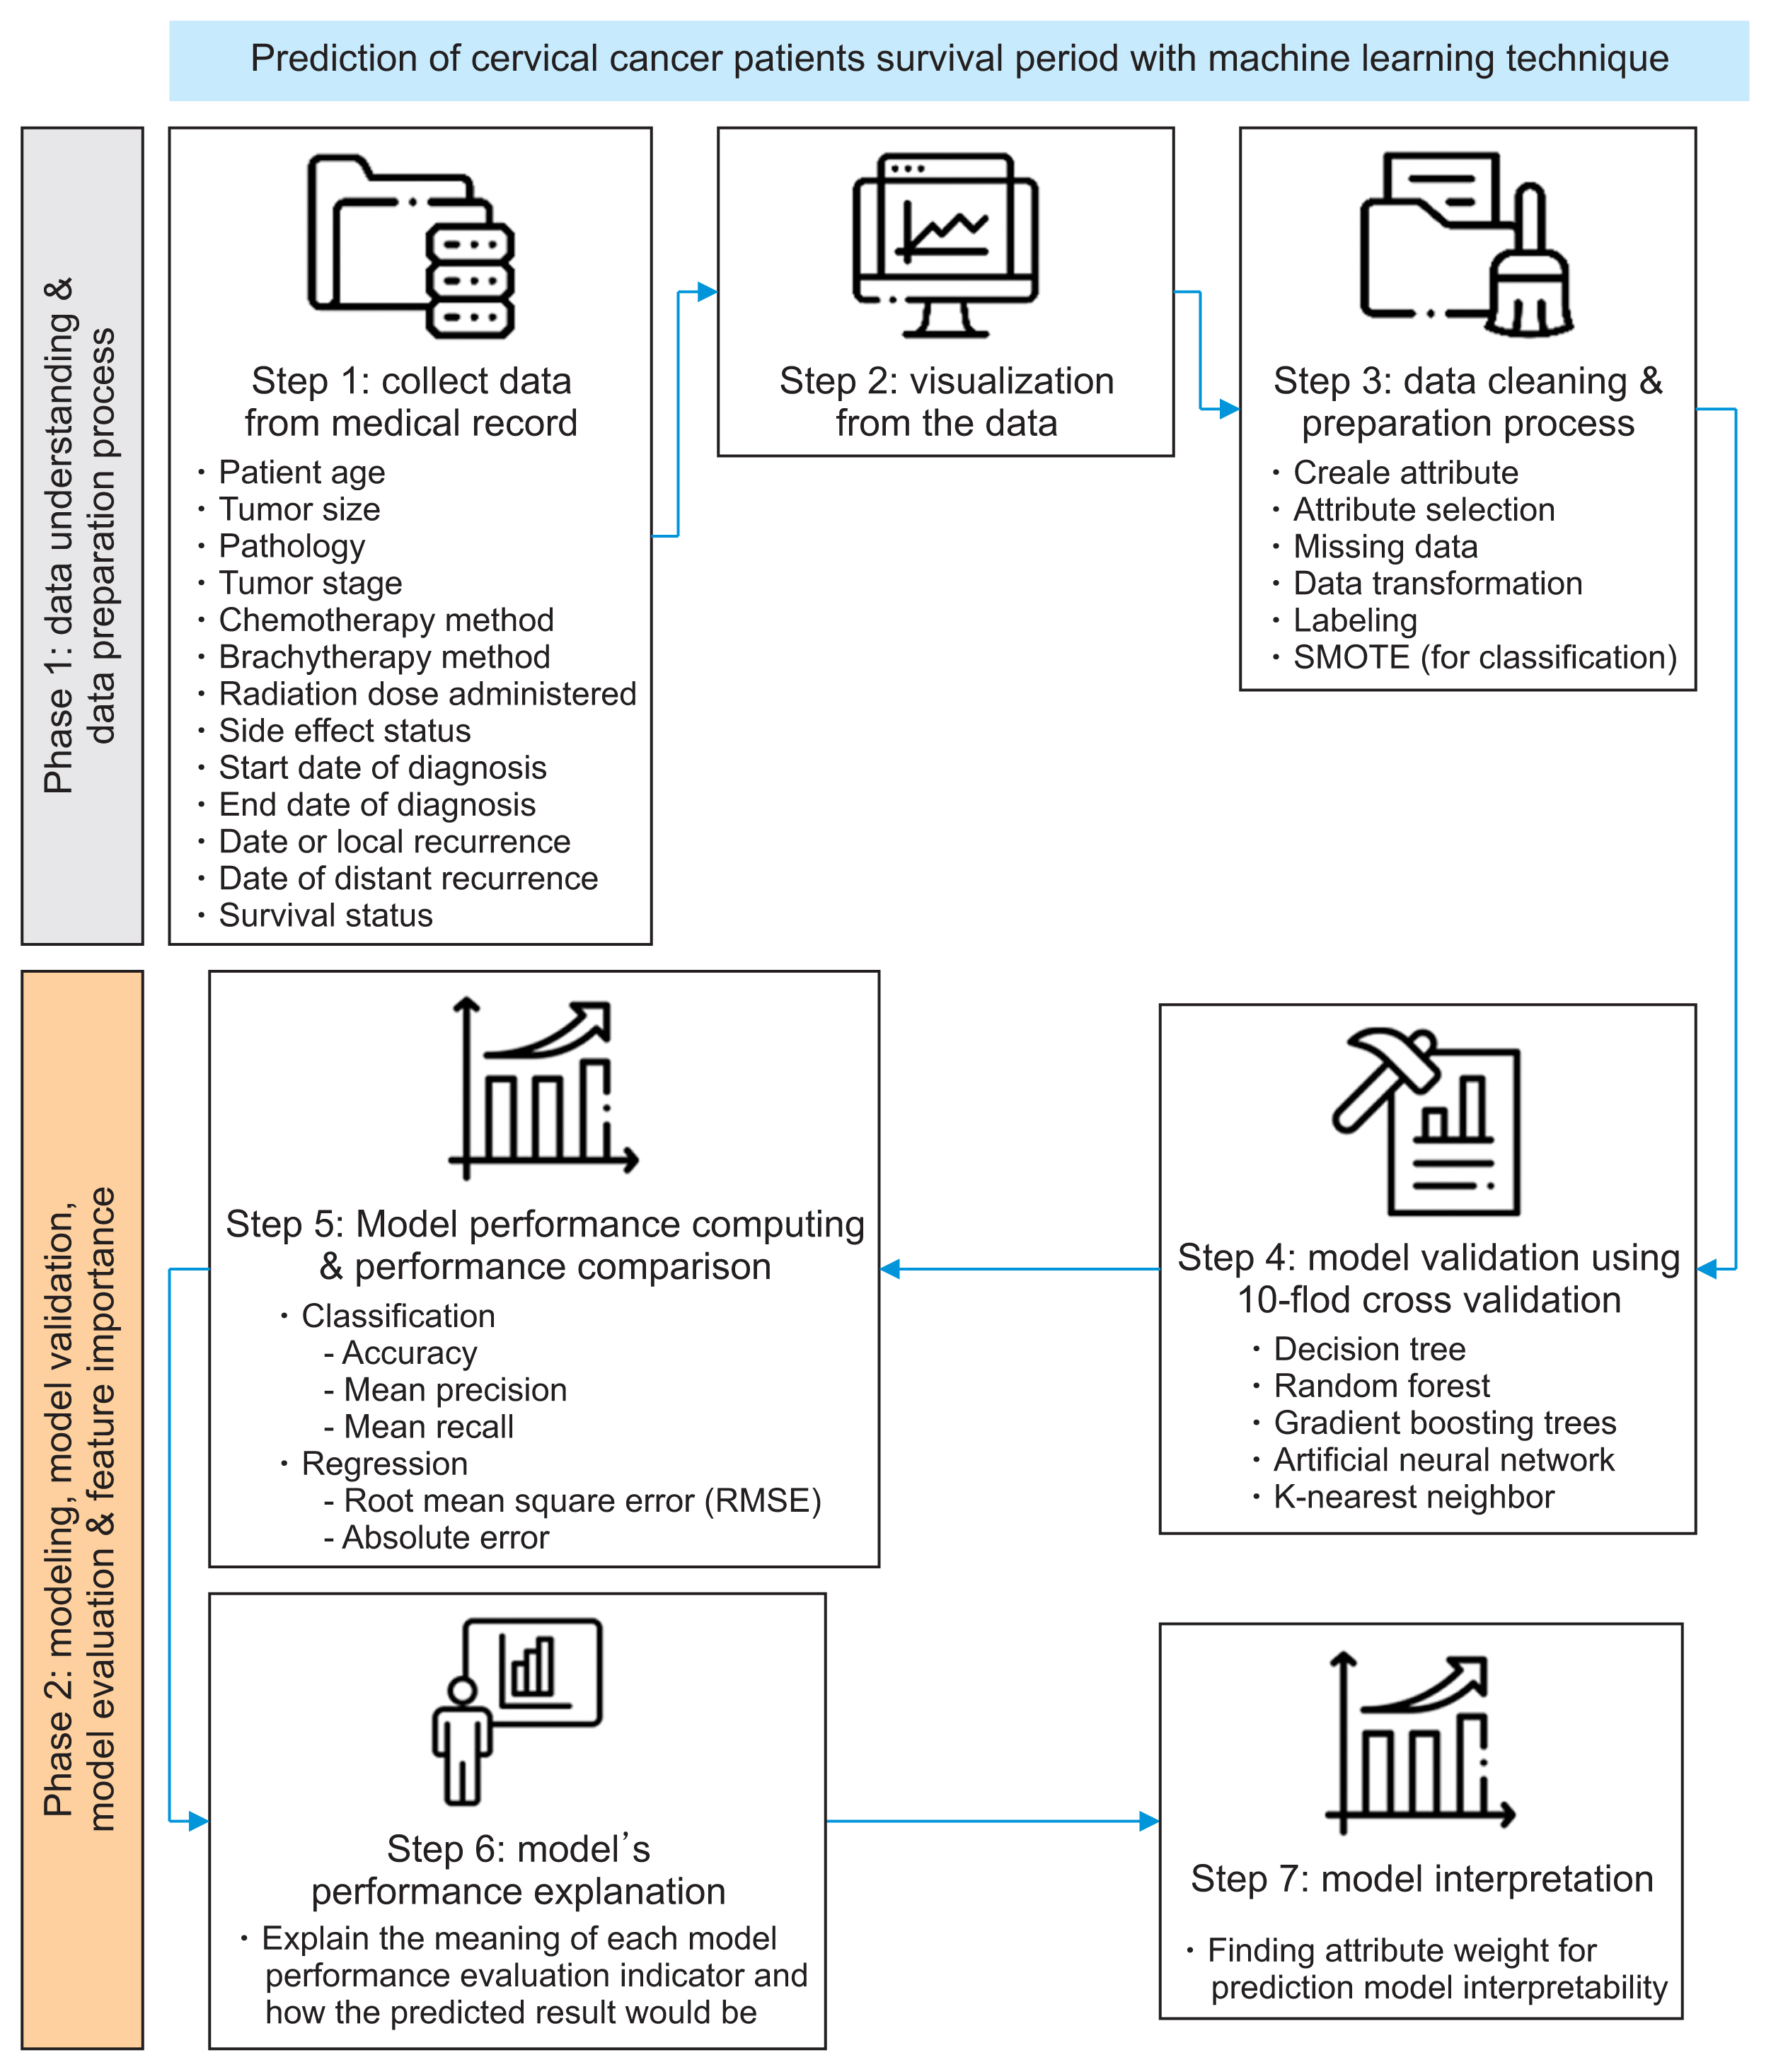
1. Dataset of Cervical Cancer Patients

The dataset of CC patients from the Faculty of Medicine at Chiang Mai University, a leading institution for health and medicine in Northern Thailand, includes an average of 150–200 patients with various types of cancer each day. The standard procedures provided include radiation therapy and brachytherapy. This dataset contains data from 295 patients. The inclusion criteria for participant selection were as follows: individuals had to be at least 18 years old, diagnosed with CC, and required computed tomography and transabdominal ultrasound-based planning for brachytherapy. Additionally, they must have received radical radiotherapy between 2008 and 2018. The exclusion criteria were as follows: patients who had undergone re-irradiation or radical surgery in the pelvis were not considered for inclusion. The clinical outcomes derived from this dataset have been previously reported in an international publication [22].
To gain insight into the data, we created visualizations using various types of graphs. Figure 1A features a histogram of patients’ ages, showing that the majority of patients were between 40 and 72 years old, spanning from working age to old age. This trend may be related to lifestyle choices and toxin exposure. Figure 1B presents a box plot of tumor sizes, with a median of 5.85 cm. The data show a broad range, with tumor sizes as small as 2.00 cm and as large as 11.70 cm. Notably, 71 patients had tumors measuring 5 cm, which lay between the first quartile and the median. Additionally, 49 patients had tumors measuring 4 cm, which was in the first quartile, indicating that many patients had tumor sizes smaller than the median.
The number of patients and the number of deaths for each tumor stage are depicted in Figure 1C. The horizontal line, accompanied by the number beneath it, represents the total patient count for each stage, whereas the vertical line indicates the number of deaths at that stage. For instance, at stage IB3, there were four patients in total, with two succumbing to the disease. Figure 1C highlights that a significant number of patients are categorized within stages IIB, IIIB, and IIIC1, with totals of 135, 80, and 37, respectively. A comparison of the mortality rates to the total patient counts reveals that stage IIIC1 has the highest death-to-patient ratio, while stage IIB exhibits a comparatively low ratio. This variation may be due to the benefits of early detection, which can lead to reduced mortality, or there may be additional factors affecting outcomes that warrant further investigation.
Figure 1D presents bar graphs that illustrate the relationship between patient mortality and the presence of side effects in various regions and at different severity levels. The graphs show that the incidence of side effects in the vaginal area, when not at level 0 or completely absent, is notably higher compared to other regions. This suggests that these variables could influence the predictive accuracy of the model. Additionally, the presence of side effects in the skin and subcutaneous tissue seems to affect the model’s predictions. A closer analysis of the ratio of patients with certain side effect statuses to the number of deaths at corresponding levels reveals that this ratio is significantly elevated, even when excluding side effects at level 0 or when there are no side effects at all.
To prepare the dataset, we generated variables such as the time intervals between the date of local recurrence and the patient’s death “Date(LC-FU),” the time interval between the date of distant recurrence and the patient’s death “Date(DF-FU),” and the time interval between the initial diagnosis date and the patient’s death. We filtered the patient data based on survival status, selecting only those with a survival status of “death” for modeling purposes. These variables were then removed from the dataset.
Variables with over 30% missing data were excluded from the dataset, resulting in a final count of 195 patients. For the remaining missing values, suitable imputation methods were employed according to the type of variable. Missing values in numeric variables were imputed with the mean, and those in categorical variables were imputed with the mode.
For ML algorithms that cannot directly process categorical and ordinal values, it is essential to convert these values into a numeric format. The one-hot encoding technique was utilized for categorical variables, while a unique integer coding method was employed for ordinal variables.
Table 1 displays the characteristics of the data, excluding the date attribute. It includes information on patients’ age, tumor size, pathology, tumor stage, chemotherapy method, brachytherapy method, the radiation dose administered, and the status of side effects. The status of side effects was classified into six levels: 0 indicates no side effects; 1 denotes normal side effects; 2 signifies side effects that require medication; 3 represents side effects that necessitate treatment; 4 describes side effects that need long-term treatment or are challenging to treat; and 5 corresponds to side effects that lead to death. Numerical variables are expressed as the mean with the standard deviation in parentheses. Ordinal and categorical variables are presented as counts with the corresponding percentages in parentheses.
Survival periods were predicted using both classification and regression approaches. The regression model used survival time in months as the target variable. For the classification model, we categorized survival time into four groups: “<6 months,” “6 months to 3 years,” “3 years to 5 years,” and “>5 years.” Figure 2 displays the distribution of records across these survival periods, revealing a notable class imbalance. To mitigate this imbalance, we employed SMOTE up-sampling to equalize the class sizes. With the data now balanced, we can proceed to construct the model and assess its performance more accurately.

2. Machine Learning Algorithm

The ML algorithm used in this study consists of five algorithms.
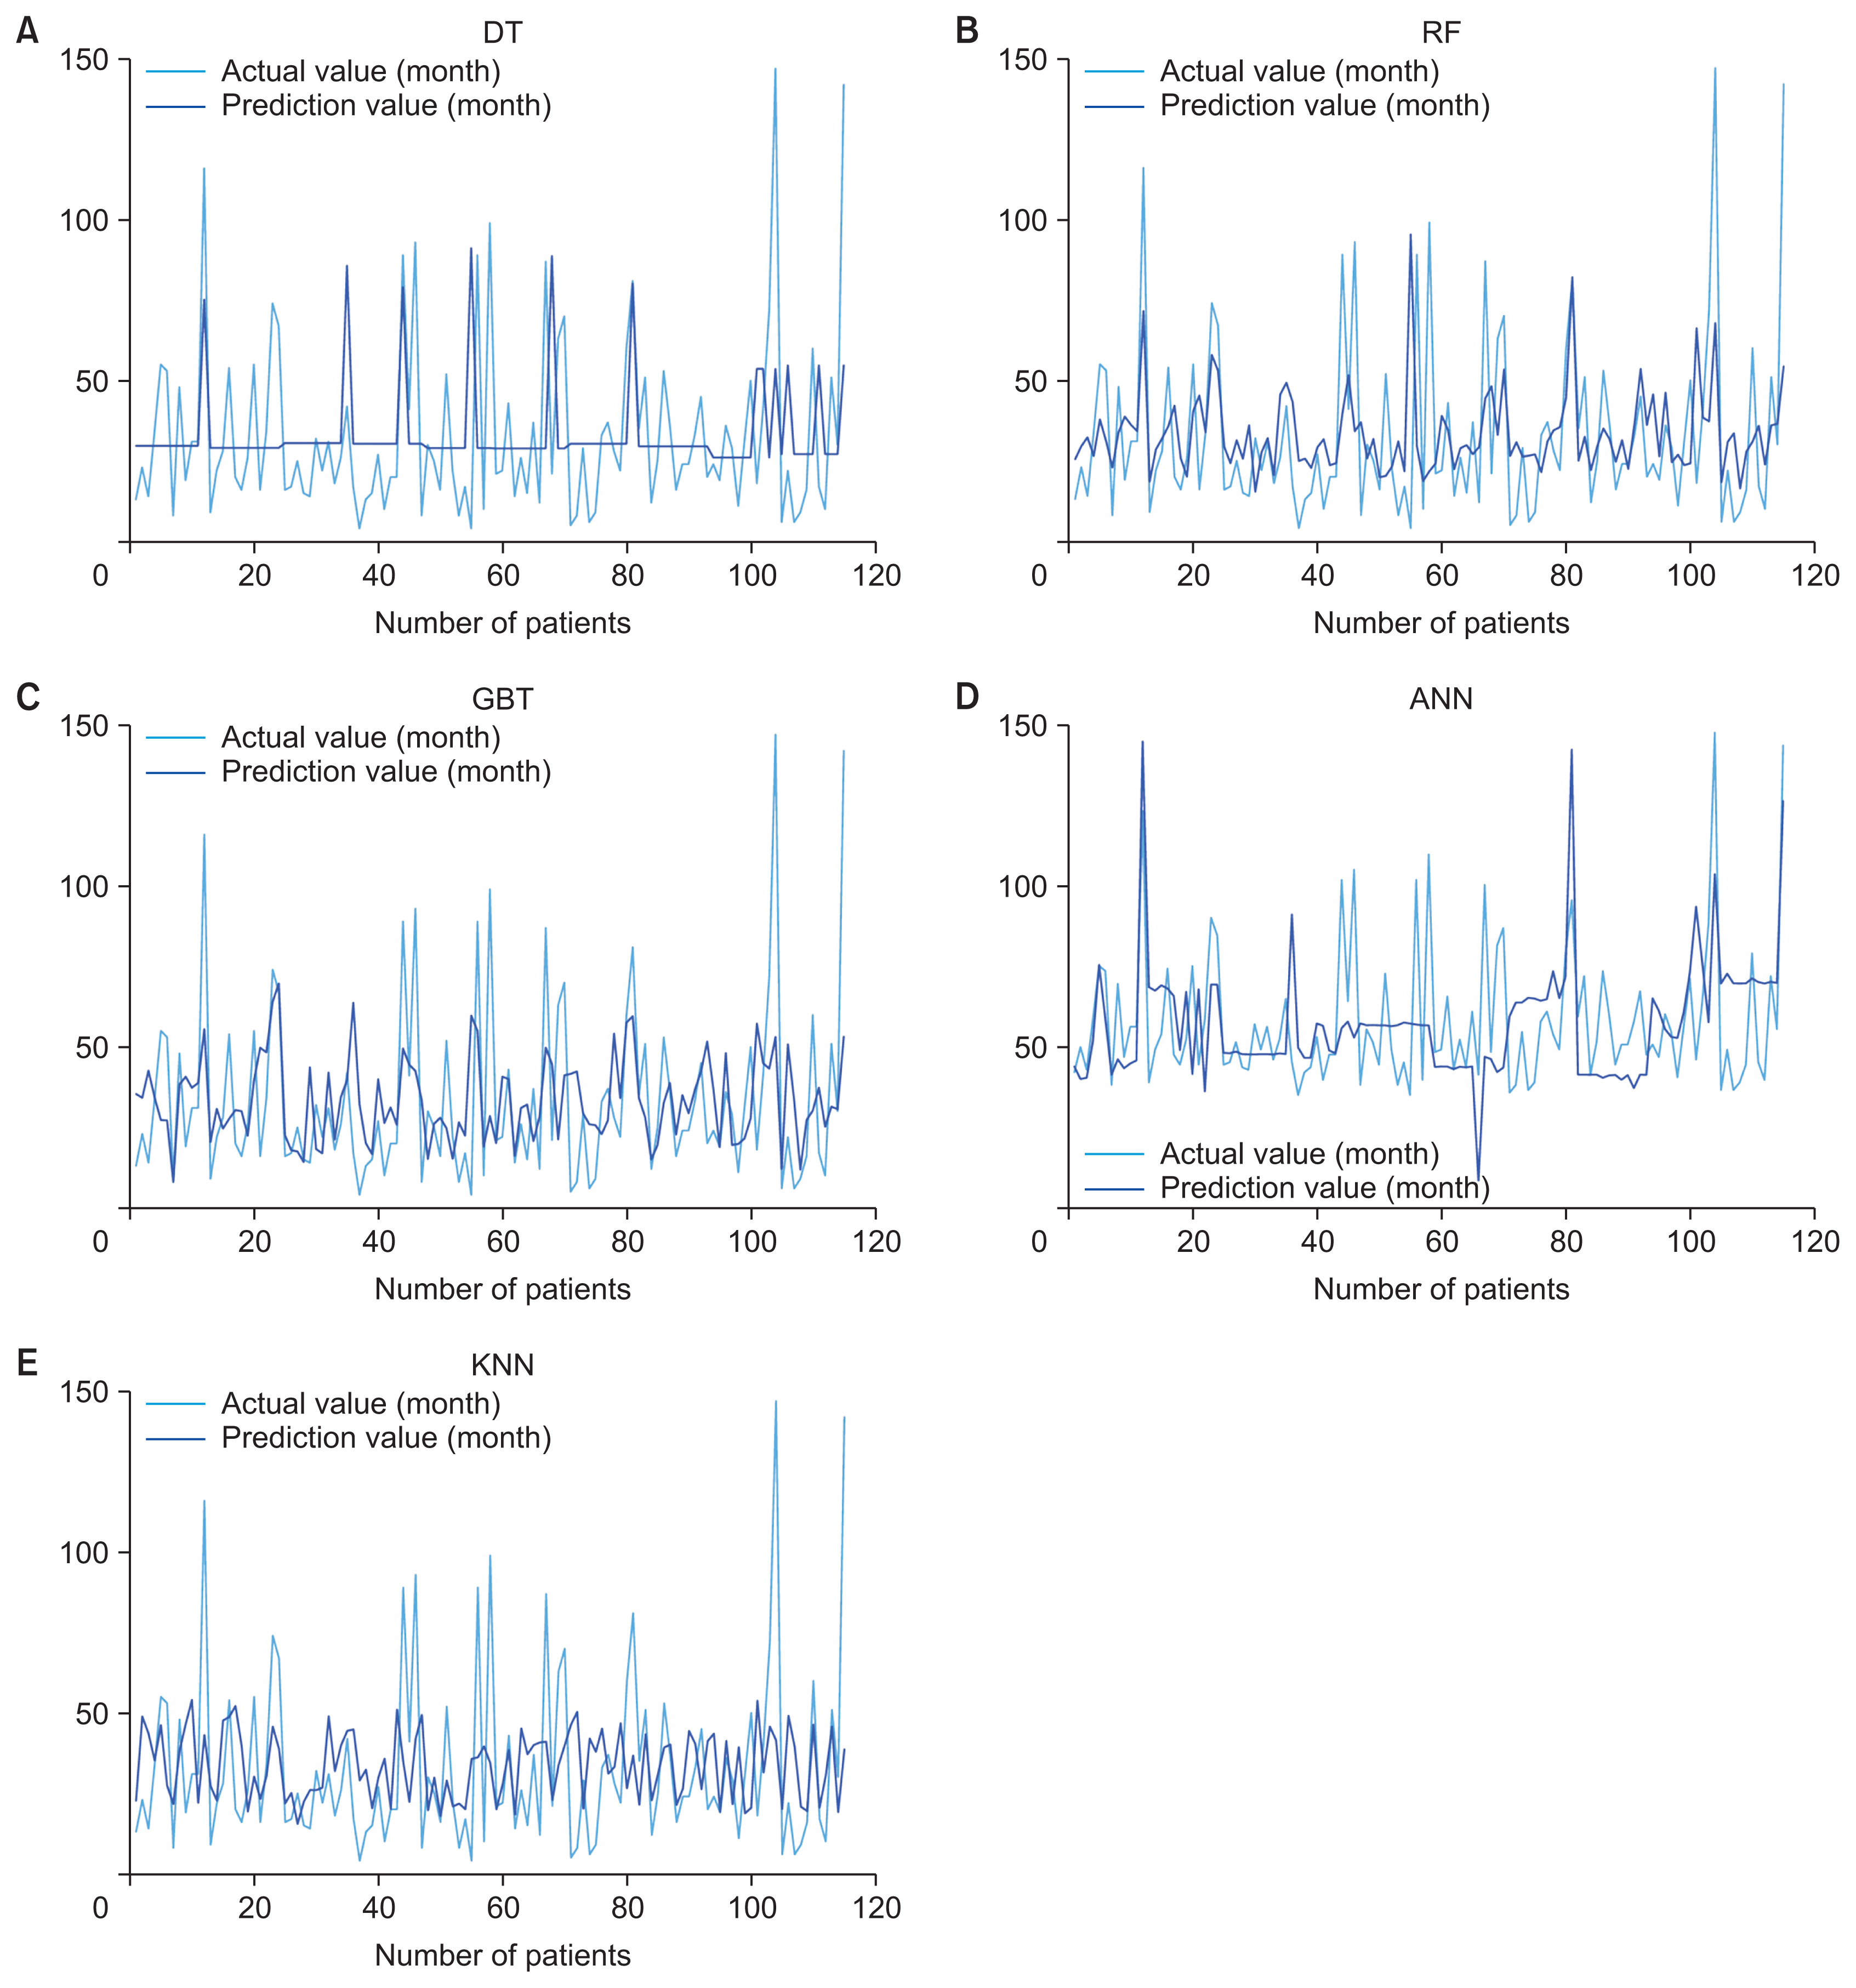
  1. The decision tree (DT) algorithm is widely used in both classification and regression problems. It facilitates hierarchical learning by employing a series of if/else questions that guide the decision-making process. This algorithm comprises three primary components: a node that specifies the attributes of the data; a branch that signifies the test for each attribute value; and a leaf that denotes the outcome for the target class or target values.

  2. The random forest (RF) algorithm is flexible and widely applicable. It operates by constructing an ensemble of decision trees and then assigning the category that garners the majority of votes, or by averaging them, depending on whether the ML modeling is for classification or regression. This approach helps to create a robust model and mitigates the risk of overfitting. In classification modeling, the final prediction is determined by the category that receives the majority of votes from a set of decision trees. Conversely, for regression modeling, predictions are made by averaging the outputs of the decision trees.

  3. Gradient boosting tree (GBT) is another widely used boosting algorithm. It utilizes the principle of amalgamating base-level models, which involve multiple simpler algorithms, to develop a better learning algorithm via decision tree construction. This approach is particularly effective for classification and regression modeling. The algorithm iteratively generates trees to correct the errors made by preceding trees, which can be described as follows:

    D(x)=d1(x)+d2(x)+d4(x)+dn(x).
    Here, dn (x) is generated by minimizing the error of dn–1 (x) with each sequentially generated tree.
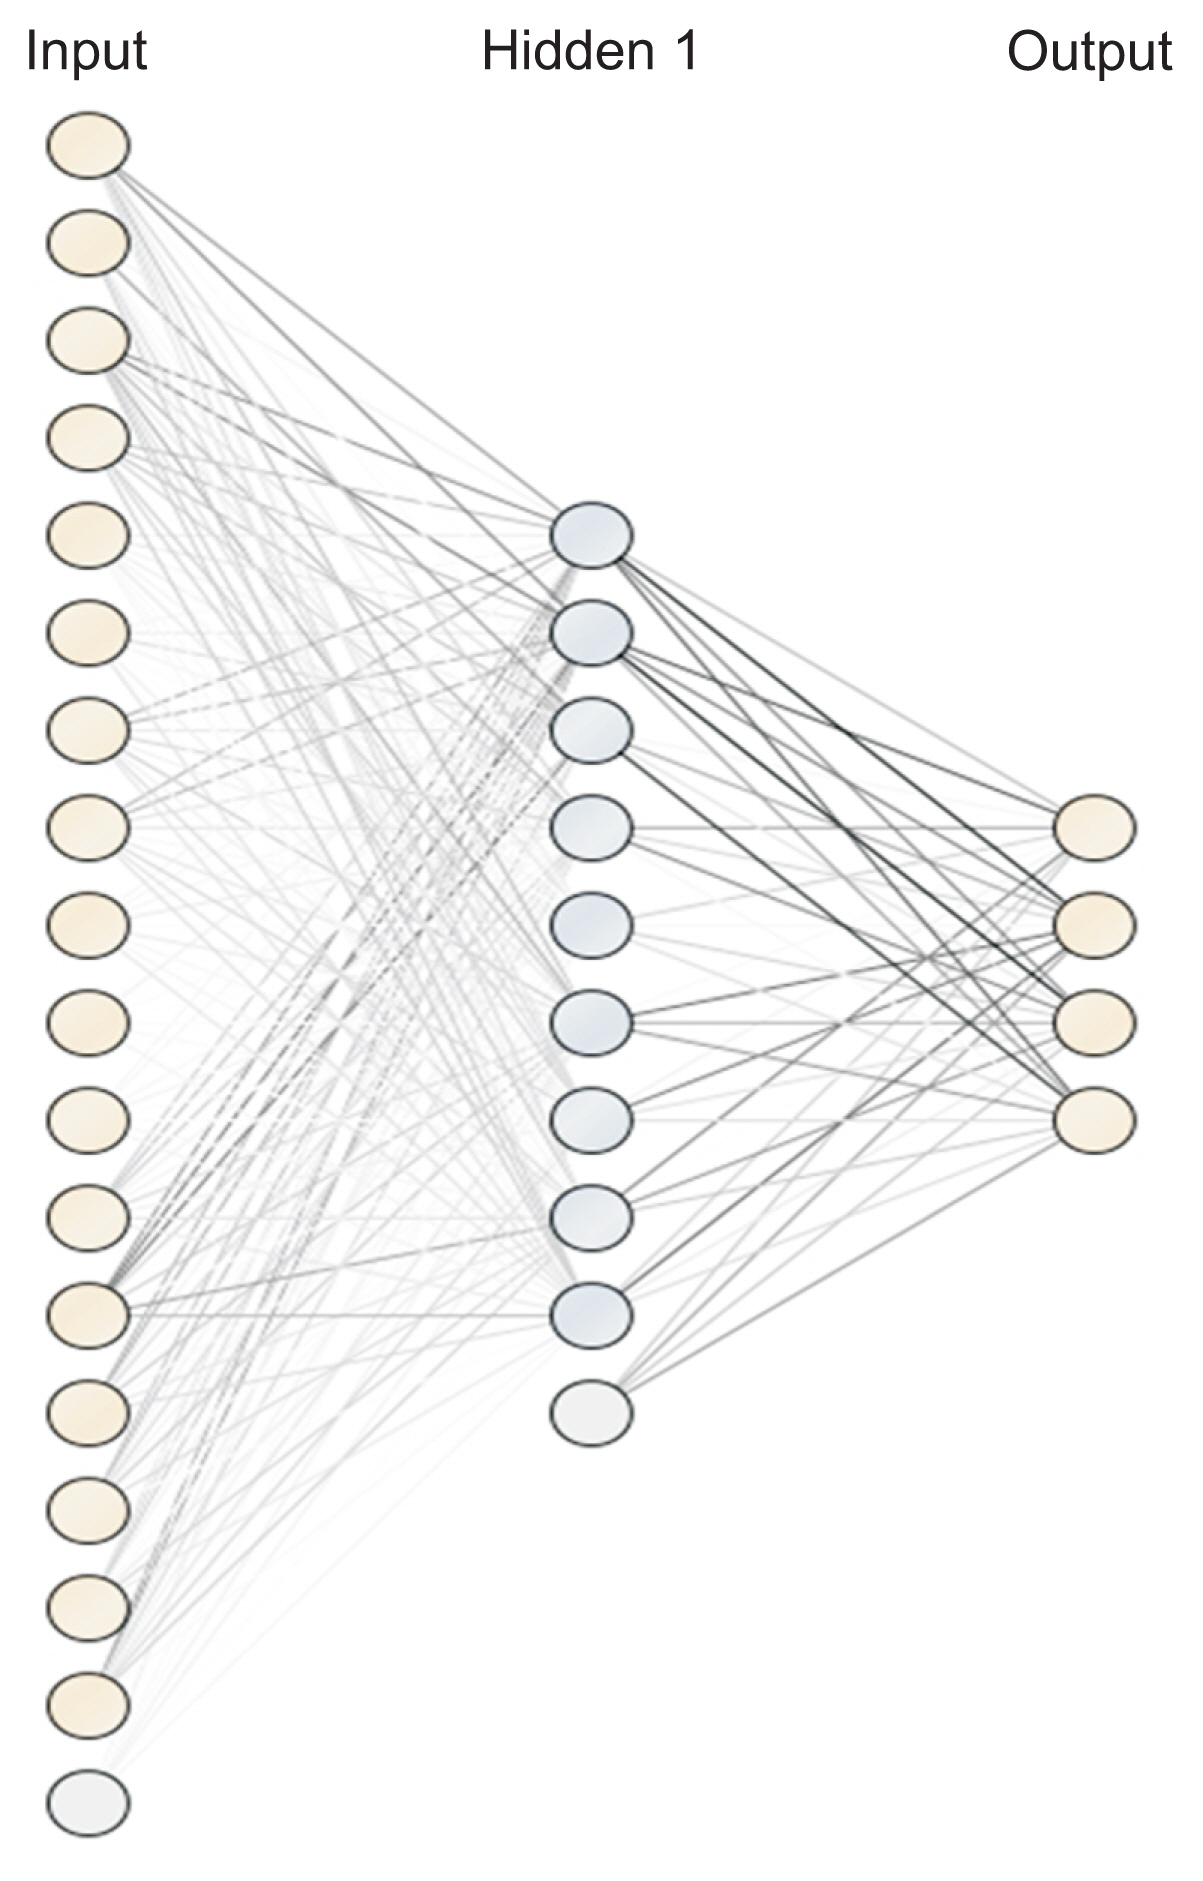
  4. An artificial neural network (ANN) is a method that simulates the function of the nervous system in the form of a network, where nodes are identified as “artificial neurons.” Creating a model of an artificial neuron involves multiplying the inputs by the different weights of each node. Then, calculations are performed using a mathematical function called the activation function to obtain the result. The formula for calculating the weighted sum is shown in following equation:

    Yin=w1x1+w2x2+w3x3++wnxn.
    In this equation, xi represents the input value i and wi represents the weight of input i. The sigmoid function was used as an activation function to determine the output from the node, as shown by the following formula:
    f(x)=11+e-x.
    Then, the backward propagation algorithm was used to improve the weights.
  5. The k-nearest neighbor (KNN) method is applicable to both classification and regression problems. It is categorized as a lazy modeling technique because all computations are deferred until after the training phase. To make predictions, KNN calculates the distance between a new data point and those in the training dataset. The decision is influenced by the k nearest data points. A larger k value helps the model minimize the impact of data noise, which can prevent inaccurate results; however, it also increases the risk of overfitting. Euclidean distance is one of the most commonly used metrics for calculating distance in this context.

3. Experiment Environment and Model Architecture

The models in this study were implemented using Rapid-Miner Software, which offers a range of both supervised and unsupervised learning algorithms. The research methodology is depicted in Figure 3. Phase 1 involved data understanding, visualization, and preparation, ensuring the data is appropriate for modeling. Phase 2 focused on the modeling and evaluation processes. The classification model, which produces categorical output, was assessed using accuracy, mean precision, and mean recall values. For regression models, which yield numerical output, the RMSE and mean absolute error (MAE) were employed for comparison. We utilized 10-fold cross-validation and optimized the hyperparameters of each model through a grid search. The classification model was designed to predict survival intervals, such as less than 6 months, 6 months to 3 years, and so on. In contrast, the regression model estimated the survival time in months. The regression model was developed using the same ML algorithms as those used for classification problems, but with modifications to accommodate numeric output. For example, the DT and RF algorithms were adjusted to use the least squares criterion for calculation, rather than the gain ratio used in the classification model.

4. Ethical Considerations

This study received approval from the Research Ethics Committee, Faculty of Medicine, Chiang Mai University (No. NONE-2565-09166). To address issues related to data privacy and access, we implemented a prevention policy that included removing personally identifiable information (PII) such as names, addresses, phone numbers, and so forth from the dataset. Additionally, access to the data was restricted to a limited number of authorized researchers.

III. Results

1. Prediction Result Comparison

The list of hyperparameters, the range of each hyperparameter, the step size of each hyperparameter in the optimization process, and the optimized hyperparameter values are presented in Table 2. Table 3 provides a detailed account of the performance of each model, using specific evaluation metrics for classification and regression tasks. For classification, the metrics include accuracy (the ratio of correctly classified results to the total dataset), mean precision (the average ratio of correctly classified results in the class of interest to all predictions in that class), and mean recall (the average ratio of correctly classified results in the class of interest to all instances in that class). Regression models, on the other hand, were evaluated using RMSE and MAE, which offer insights into the discrepancies between actual and predicted values. These indicators served as benchmarks for comparing model performance.
Evaluation indicators differ between classification and regression problems. In classification models, higher accuracy, mean precision, and mean recall indicate more accurate predictions across all classes. On the other hand, in regression models, lower RMSE and MAE values suggest a smaller discrepancy between actual and predicted values, denoting greater accuracy in predictions.
Table 3 shows that the GBT model achieved the highest performance in correctly and completely identifying the target class, with an accuracy of 86.52% compared to the others. Additionally, when examining the mean precision and mean recall, which are average values derived from the four target classes, the GBT algorithm demonstrates high scores in both metrics. This suggests that the prediction model possesses a strong capability to accurately and comprehensively identify the target class.
Table 3 highlights the superior regression performance of the RF model, as indicated by its lowest RMSE and MAE values, which are 22.33 and 17.07, respectively. The analysis of performance and data suggests that the dataset is relatively small, and the model’s performance could be improved by expanding the volume of data. However, when the regression model is applied to high survival times, the error increases due to the lack of an upper bound.
The KNN algorithm exhibited low performance in both classification and regression tasks, achieving an accuracy of 68.08% and an RMSE of 25.45. Furthermore, the results indicate that both RF and GBT algorithms deliver high performance in these tasks. Conversely, DT and ANN algorithms appear to perform better in classification than in regression. This suggests that these two algorithms (DT and ANN) may be better suited to specific types of predictions (classification or regression) or that they may not be adept at handling medical record data. Figure 4 illustrates the ANN architecture for the classification model, which includes 18 nodes in the input layer to represent each input variable, a single hidden layer with nine nodes, and four output nodes corresponding to the four target classes. The regression model employs the same number of input nodes but features a hidden layer with 10 nodes and a single output node that represents the numeric survival time.
As shown in Figure 5, the ANN model demonstrated proficiency in managing data for patients with high survival times in regression analysis, yet it showed variability in its predictions when compared to other models. Both the RF and GBT models yielded comparable results, with the RF model exhibiting a narrower prediction gap. Conversely, the DT model failed to deliver accurate results, suggesting a poor fit with the dataset. The KNN model, meanwhile, showed improved performance.
The results indicate that ensemble learning can yield more accurate predictions for medical record datasets in both classification and regression tasks. This suggests that it is capable of managing datasets with high variability and addressing inconsistencies in patients’ medical records.

2. Attribute Weights

Determining the attribute weights that influence survival time is crucial for a deeper understanding of how various attributes affect CC survival. This knowledge is especially valuable for informed healthcare decision-making. In this study, we established the attribute weights by employing the optimal ML models identified in the preceding step. Specifically, we used GBT for classification and RF models for regression.
The weights of the attributes are depicted in Figure 6, sorted from the largest to smallest. In the classification model, Date(DF-FU) had the greatest effect on the prediction of target class, followed by Vg and Subc. For the regression model, Age had the highest influence on the prediction result, followed by Cx and B, respectively.
In statistical survival analysis, datasets often exclude side effects and radiation doses near organs. However, in this study, these factors were included to adhere to ML principles that advocate for the consideration of all potentially relevant variables. As the model becomes well-trained, it will automatically exclude factors that are deemed insignificant. Including these variables aids in evaluating patient responses to treatment, thereby enhancing the accuracy of prognostic assessments.

IV. Discussion

An analysis of the data indicated that women aged 40 to 72 were at an increased risk of CC, which is consistent with previous research that showed a higher prevalence in the 40–60 age group compared to younger women. The observed tumor sizes ranging from 4 to 7 cm are in agreement with similar findings reported in other studies [23,24]. Despite variations in variables due to differences in inclusion/ exclusion criteria and data collection methods, our dataset is consistent with those from other studies. This suggests that the performance of the model, as based on this dataset, may be indicative of its application in the real world.
ML has garnered significant attention in CC research, particularly in areas like diagnosis, detection, treatment response, and, notably, survival prediction [25]. Algorithms such as DT, RF, GBT, ANN, and KNN are widely recognized in the field and were also used in this study. Additionally, attribute weights were determined to aid in interpreting the prediction results.
GBT excelled in the classification model, achieving an accuracy of 86.52%, while RF performed best in the regression model, with an RMSE of 22.33. The overall superiority of ML techniques is evident, demonstrating their suitability for both classification and regression predictions. Previous research using the same dataset focused on assessing the impact of variables and reporting overall survival rates, employing the Kaplan-Meier curve and log-rank test to evaluate the overall survival rate, and univariate and multivariate analyses to assess prognostic factors. Therefore, direct comparisons with our study, which concentrates on predicting survival time, are not feasible. However, based on research results in the same field, the performance of prediction models built for both classification and regression is known to be relatively accurate [9,1822].
The data used in this research were from CC patients in Northern Thailand. If there are plans to apply the model in other environments, it will be crucial to verify its compatibility with that specific situation. Otherwise, there may be a need for remodeling based on the research framework.
Furthermore, identifying the attribute weights yields a comprehensive understanding of the dataset. The attribute identification results highlight that the radiation dose given around any areas (Cx, B, and R) and Date(DF-FU) strongly influenced both classification and regression. In contrast, tumor size appeared to have a less significant impact on outcomes, regardless of differing study objectives with similar datasets. This implies that size may not be a key factor in this area of research. Notably, when evaluating prognostic factors for overall survival, both pathology histology and tumor stage are statistically significant. While some of our findings are consistent with previous research, particularly regarding the importance of tumor stage, there are discrepancies. For example, histopathology shows different outcomes in our study compared to those reported in the study by Tharavichitkul et al. [22]. The insights gained from this research could assist in the planning and resource allocation for patient care. Furthermore, these findings have the potential to improve services for CC patients and provide a valuable resource for healthcare professionals.

Acknowledgments

Intorn Chanudom is a student in Master’s Degree Program in Industrial Engineering, Faculty of Engineering, Chiang Mai University, Chiang Mai, Thailand. This work is supported by the Faculty of Engineering, Chiang Mai University.

Notes

Conflict of Interest

No potential conflict of interest relevant to this article was reported.

Figure 1
Visualization of variables within the dataset: (A) age distribution of patients, (B) distribution of tumor size, (C) number of patients and number of deaths for each tumor stage, and (D) the relationship between patient mortality and side effects in different areas at different levels.
hir-2024-30-1-60f1.jpg
Figure 2
Amount of data for each target variable for classification model modeling.
hir-2024-30-1-60f2.jpg
Figure 3
Research framework.
hir-2024-30-1-60f3.jpg
Figure 4
Artificial neural network architecture of the classification model.
hir-2024-30-1-60f4.jpg
Figure 5
Comparison of the actual survival time and the predicted time when using each model: (A) decision tree (DT), (B) random forest (RF), (c) gradient boosting tree (GBT), (D) artificial neural network (ANN), and (E) k-nearest neighbor (KNN).
hir-2024-30-1-60f5.jpg
Figure 6
Attribute weight values in both classification and regression. See Table 1 for the full-term of the attribute.
hir-2024-30-1-60f6.jpg
Table 1
Variables and basic statistical information in the patient dataset
Variable Basic statistical information Type
Patient age (yr) 52.26 ± 10.36 Numeric

Tumor size (cm) 5.29 ± 1.74 Numeric

Pathology (PAT) Category
 Squamous cell carcinoma 91 (79.13)
 Adenocarcinoma 20 (17.39)
 Other 4 (3.48)

Tumor stage (FIGO stage 2018) Ordinal
 IA1 0 (0)
 IA2 0 (0)
 IB1 0 (0)
 IB2 0 (0)
 IB3 2 (1.74)
 IIA1 0 (0)
 IIA2 2 (1.74)
 IIB 43 (37.39)
 IIIA 1 (0.87)
 IIIB 33 (28.70)
 IIIC1 17 (14.78)
 IIIC2 10 (8.70)
 IVA 4 (3.48)
 IVB 3 (2.61)

Brachytherapy (TECH) Category
 Computed tomography 53 (46.09)
 Transabdominal ultrasound 62 (53.91)

Chemotherapy (CHEM) Category
 Yes 112 (97.39)
 No 3 (2.61)

Radiation dose given in EQD2 (Gy)Cervix (Cx) Numeric
 Bladder (B) 85.60 ± 4.05
 Rectum (R) 77.17 ± 11.82
 Side effect status 73.32 ± 8.14 Ordinal

Gastrointestinal tract (GI)
 0 108 (93.91)
 1 4 (3.48)
 2 2 (1.74)
 3 1 (0.87)
 4 0 (0)
 5 0 (0)

Genito-urinary tracts (GU)0 112 (97.39)
 1 2 (1.74)
 2 1 (0.87)
 3 0 (0)
 4 0 (0)
 5 0 (0)

Skin (Skin)
 0 110 (95.65)
 1 4 (3.48)
 2 1 (0.87)
 3 0 (0)
 4 0 (0)
 5 0 (0)

Subcutaneous (Subc)
 0 108 (93.91)
 1 5 (4.35)
 2 2 (1.74)
 3 0 (0)
 4 0 (0)
 5 0 (0)

Vagina (Vg)
 0 89 (77.39)
 1 18 (15.65)
 2 6 (5.22)
 3 2 (1.74)
 4 0 (0)
 5 0 (0)

Values are presented as mean ± standard deviation or number (%).

FIGO: International Federation of Gynecology & Obstetrics, EQD2: equivalent dose in 2 Gy fraction

Table 2
The list of hyperparameters and optimized values of each model in both classification and regression
Algorithm Classification Regression


Hyperparameter Range Step Optimize hyperparameter Hyperparameter Range Step Optimize hyperparameter
DT maximal_depth 1–20 20 15 maximal_depth 1–20 20 2
minimal_gain 0–1 10 0.1 minimal_gain 0–1 10 0.1

RF number_of_trees 1–100 10 41 number_of_trees 1–100 10 41
maximal_depth 0–100 10 80 maximal_depth 0–100 10 80

GBT number_of_trees 1–1000 10 1000 number_of_trees 1–1000 10 1000
maximal_depth 1–100 10 11 maximal_depth 1–100 10 1

ANN hidden_layer_size 1–10 10 9 hidden_layer_size 1–10 10 10
training_cycles 1–100 10 100 training_cycles 1–100 10 31
learning_rate 0–1 10 0.1 learning_rate 0–1 10 0.2

KNN k 1–100 10 11 k 1–100 10 11

DT: decision tree, RF: random forest, GBT: gradient boosting tree, ANN: artificial neural network, KNN: k-nearest neighbor.

Table 3
Performance evaluation of each model
Algorithm Classification Regression


Accuracy (%) Mean precision (%) Mean recall (%) RMSE MAE
DT 74.95 74.94 75.48 25.25 19.14

RF 86.15 86.25 86.62 22.33 17.07

GBT 86.52 86.65 88.00 23.11 17.27

ANN 82.91 82.90 84.56 25.95 20.75

KNN 68.08 68.09 69.54 25.45 19.49

DT: decision tree, RF: random forest, GBT: gradient boosting tree, ANN: artificial neural network, KNN: k-nearest neighbor, RMSE: root mean squared error, MAE: mean absolute error.

References

1. Hassanpour SH, Dehghani M. Review of cancer from perspective of molecular. J Cancer Res Pract 2017 4(4):127-9. https://doi.org/10.1016/j.jcrpr.2017.07.001
crossref
2. Sudhakar A. History of cancer, ancient and modern treatment methods. J Cancer Sci Ther 2009 1(2):1-4. https://doi.org/10.4172/1948-5956.100000e2
crossref pmid
3. Schneider IJ, Schmidt TP, dos Santos AM, Correa VP, Garcia LP, de Oliveira C, et al. Overall survival analyses of female malignancies in Southern Brazil during 2008–2017: a closer look at breast, cervical and ovarian cancer. Dialogues Health 2022 1:100010.https://doi.org/10.1016/j.dialog.2022.100010
crossref pmid pmc
4. Vaiyapuri T, Alaskar H, Syed L, Aljohani E, Alkhayyat A, Shankar K, et al. Modified metaheuristics with stacked sparse denoising autoencoder model for cervical cancer classification. Comput Electr Eng 2022 103:108292.https://doi.org/10.1016/j.compeleceng.2022.108292
crossref
5. Riano I, Contreras-Chavez P, Pabon CM, Meza K, Kiel L, Bejarano S, et al. An overview of cervical cancer prevention and control in Latin America and the Caribbean countries. Hematol Oncol Clin North Am 2024 38(1):13-33. https://doi.org/10.1016/j.hoc.2023.05.012
crossref pmid
6. Parvathi AJ, Gopika H, Suresh J, Sree SL, Harikumar S. Machine learning based approximate query processing for women health analytics. Procedia Comput Sci 2023 218:174-88. https://doi.org/10.1016/j.procs.2022.12.413
crossref
7. Lee SH, Abdul Rahim N, Ong SK, Abdul Rahman H, Naing L. Survival of cervical cancer patients in Brunei Darussalam: 2002–2017. Heliyon 2023 9(5):e16080.https://doi.org/10.1016/j.heliyon.2023.e16080
crossref pmid pmc
8. Khan A, Hussain S, Iyer JK, Kaul A, Bonnewitz M, Kaul R. Human papillomavirus-mediated expression of complement regulatory proteins in human cervical cancer cells. Eur J Obstet Gynecol Reprod Biol 2023 288:222-8. https://doi.org/10.1016/j.ejogrb.2023.07.014
crossref pmid
9. Alabi RO, Makitie AA, Pirinen M, Elmusrati M, Leivo I, Almangush A. Comparison of nomogram with machine learning techniques for prediction of overall survival in patients with tongue cancer. Int J Med Inform 2021 145:104313.https://doi.org/10.1016/j.ijmedinf.2020.104313
crossref pmid
10. Zhu S, Zheng Z, Hu W, Lei C. Conditional cancer-specific survival for inflammatory breast cancer: analysis of SEER, 2010 to 2016. Clin Breast Cancer 2023 23(6):628-39. https://doi.org/10.1016/j.clbc.2023.05.005
crossref pmid
11. Zhao M, Huang W, Zou S, Shen Q, Zhu X. A five-genes-based prognostic signature for cervical cancer overall survival prediction. Int J Genomics 2020 2020:8347639.https://doi.org/10.1155/2020/8347639
crossref pmid pmc
12. Kleinbaum DG, Klein M. Survival analysis a self-learning text. 3rd ed. New York (NY): Springer; 2012. https://doi.org/10.1007/978-1-4419-6646-9

13. Rebernick RJ, Bell HN, Wakeam E. Survival analyses: a statistical review for surgeons. Semin Thorac Cardiovasc Surg 2022 34(4):1388-94. https://doi.org/10.1053/j.semtcvs.2022.01.001
crossref pmid
14. Matsuo K, Purushotham S, Jiang B, Mandelbaum RS, Takiuchi T, Liu Y, et al. Survival outcome prediction in cervical cancer: Cox models vs deep-learning model. Am J Obstet Gynecol 2019 220(4):381.https://doi.org/10.1016/j.ajog.2018.12.030
crossref
15. Adeoye J, Tan JY, Choi SW, Thomson P. Prediction models applying machine learning to oral cavity cancer outcomes: a systematic review. Int J Med Inform 2021 154:104557.https://doi.org/10.1016/j.ijmedinf.2021.104557
crossref pmid
16. Su Y, Tian X, Gao R, Guo W, Chen C, Chen C, et al. Colon cancer diagnosis and staging classification based on machine learning and bioinformatics analysis. Comput Biol Med 2022 145:105409.https://doi.org/10.1016/j.compbiomed.2022.105409
crossref pmid
17. Guo C, Wang J, Wang Y, Qu X, Shi Z, Meng Y, et al. Novel artificial intelligence machine learning approaches to precisely predict survival and site-specific recurrence in cervical cancer: a multi-institutional study. Transl Oncol 2021 14(5):101032.https://doi.org/10.1016/j.tranon.2021.101032
crossref pmid pmc
18. Lynch CM, Abdollahi B, Fuqua JD, de Carlo AR, Bartholomai JA, Balgemann RN, et al. Prediction of lung cancer patient survival via supervised machine learning classification techniques. Int J Med Inform 2017 108:1-8. https://doi.org/10.1016/j.ijmedinf.2017.09.013
crossref pmid pmc
19. Wang Y, Ji C, Wang Y, Ji M, Yang JJ, Zhou CM. Predicting postoperative liver cancer death outcomes with machine learning. Curr Med Res Opin 2021 37(4):629-34. https://doi.org/10.1080/03007995.2021.1885361
crossref pmid
20. Akcay M, Etiz D, Celik O, Ozen A. Evaluation of prognosis in nasopharyngeal cancer using machine learning. Technol Cancer Res Treat 2020 19:1533033820909829.https://doi.org/10.1177/1533033820909829
crossref pmid pmc
21. Tapak L, Shirmohammadi-Khorram N, Amini P, Alafchi B, Hamidi O, Poorolajal J. Prediction of survival and metastasis in breast cancer patients using machine learning classifiers. Clin Epidemiol Glob Health 2019 7(3):293-9. https://doi.org/10.1016/j.cegh.2018.10.003
crossref
22. Tharavichitkul E, Jia-Mahasap B, Muangwong P, Chakrabandhu S, Klunklin P, Onchan W, et al. Survival outcome of cervical cancer patients treated by image-guided brachytherapy: a ‘real world’ single center experience in Thailand from 2008 to 2018. J Radiat Res 2022 63(4):657-65. https://doi.org/10.1093/jrr/rrac025
crossref pmid pmc
23. Zhou YY, Chang M, Li CP, Han XL, Fang P, Xia XP. Causal effect of age first had sexual intercourse and lifetime number of sexual partners on cervical cancer. Heliyon 2023 10(1):e23758.https://doi.org/10.1016/j.heliyon.2023.e23758
crossref pmid pmc
24. Gill BS, Lin JF, Krivak TC, Sukumvanich P, Laskey RA, Ross MS, et al. National Cancer Data Base analysis of radiation therapy consolidation modality for cervical cancer: the impact of new technological advancements. Int J Radiat Oncol Biol Phys 2014 90(5):1083-90. https://doi.org/10.1016/j.ijrobp.2014.07.017
crossref pmid
25. Fiste O, Liontos M, Zagouri F, Stamatakos G, Dimopoulos MA. Machine learning applications in gynecological cancer: a critical review. Crit Rev Oncol Hematol 2022 179:103808.https://doi.org/10.1016/j.critrevonc.2022.103808
crossref pmid


ABOUT
ARTICLE CATEGORY

Browse all articles >

BROWSE ARTICLES
FOR CONTRIBUTORS
Editorial Office
1618 Kyungheegung Achim Bldg 3, 34, Sajik-ro 8-gil, Jongno-gu, Seoul 03174, Korea
Tel: +82-2-733-7637, +82-2-734-7637    E-mail: hir@kosmi.org                

Copyright © 2024 by Korean Society of Medical Informatics.

Developed in M2community

Close layer
prev next